nifi-kafka-druid-earthquake-data
|
This guide assumes that you already have the demo |
This demo will
-
Install the required Stackable operators
-
Spin up the follow data products
-
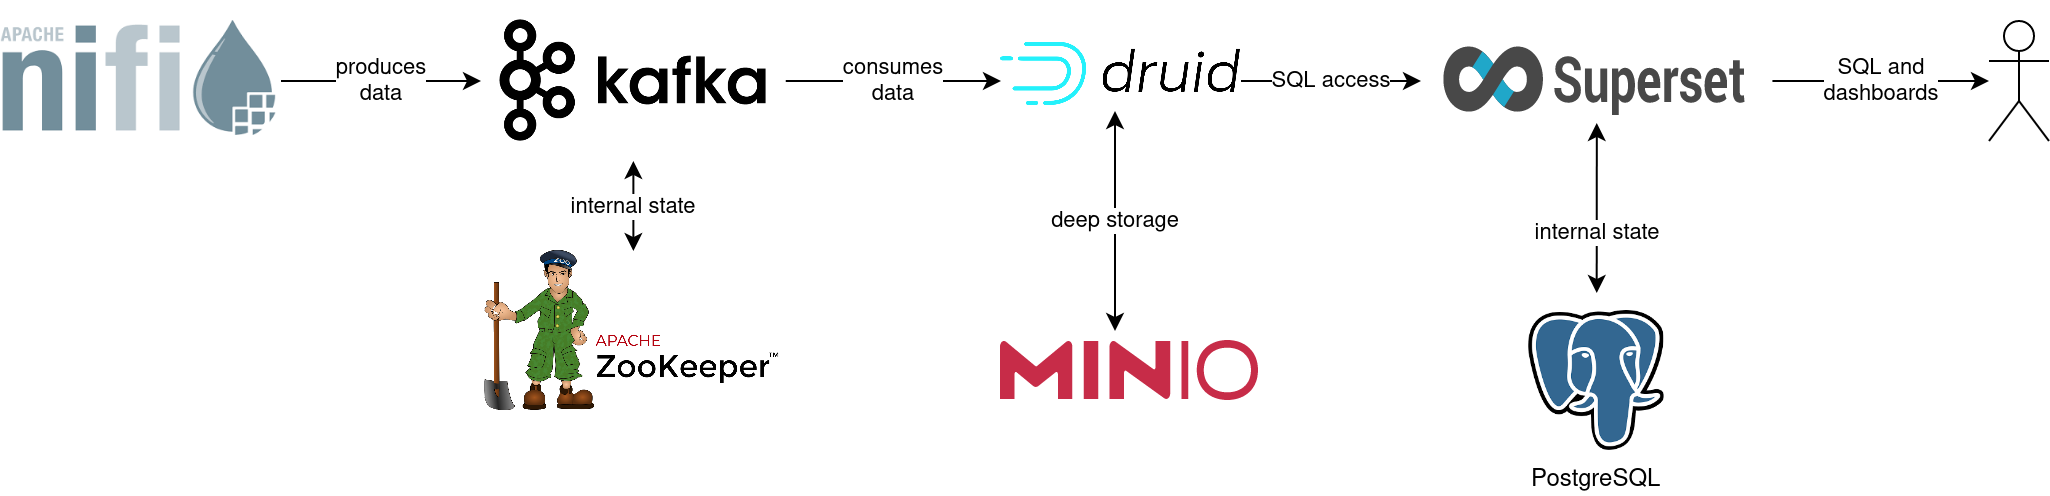
Superset: A modern data exploration and visualization platform. This demo utilizes Superset to retrieve data from Druid via SQL queries and build dashboards on top of that data
-
Kafka: A distributed event streaming platform for high-performance data pipelines, streaming analytics and data integration. This demos uses it as an event streaming platform to stream the data in near real-time
-
NiFi: An easy-to-use, powerful system to process and distribute data. This demos uses it to fetch earthquake-data from the internet and ingest it into Kafka
-
Druid: A real-time database to power modern analytics applications. This demo uses it to ingest the near real-time data from Kafka, store it and enable to access the data via SQL
-
MinIO: A S3 compatible object store. This demo uses it as persistent storage for Druid to store all the data used
-
-
Continuously emit approximately 10,000 records/s of earthquake data into Kafka
-
Start a Druid ingestion job that ingests the data into the Druid instance
-
Create Superset dashboards for visualization of the data
The whole data pipeline will have a very low latency from putting a record into Kafka to it showing up in the dashboard charts.
You can see the deployed products as well as their relationship in the following diagram:
List deployed Stackable services
To list the installed Stackable services run the following command:
$ stackablectl services list --all-namespaces
 PRODUCT    NAME         NAMESPACE  ENDPOINTS                                    EXTRA INFOS

 druid      druid        default    broker-http        http://172.18.0.3:32670
                                    coordinator-http   http://172.18.0.3:30392
                                    historical-http    http://172.18.0.2:30831
                                    middlemanager-http http://172.18.0.4:30356
                                    router-http        http://172.18.0.4:30109

 kafka      kafka        default    kafka              172.18.0.4:30968

 nifi       nifi         default    https              https://172.18.0.3:32558  Admin user: admin, password: adminadmin

 superset   superset     default    external-superset  http://172.18.0.3:32108   Admin user: admin, password: adminadmin

 zookeeper  zookeeper    default    zk                 172.18.0.2:32309

 minio      minio-druid  default    http               http://172.18.0.4:32306   Third party service
console-http http://172.18.0.4:31664 Admin user: admin, password: adminadmin|
When a product instance has not finished starting yet, the service will have no endpoint. Starting all the product instances might take a considerable amount of time depending on your internet connectivity. In case the product is not ready yet a warning might be shown. |
Inspect data in Kafka
Kafka is used as an event streaming platform to stream the data in near real-time.
All the messages put in and read from Kafka are structured in dedicated queues called topics.
The test data will be put in a topic called earthquakes.
The records get produced (put in) by the test data generator and are consumed (read) by Druid afterwards in the same order they where produced.
As Kafka itself has no webinterface you have to use a Kafka client like kafkacat.
In order to connect to Kafka, use the kafka endpoint from the kafka service in your stackablectl services list command output (172.18.0.4:30968 in this case).
If you have kafkacat installed, you can see the available brokers and topics with the following command.
You need to replace the -b parameter to match your Kafka endpoint.
$ kafkacat -b 172.18.0.4:30968 -L
Metadata for all topics (from broker -1: 172.18.0.4:30968/bootstrap):
 1 brokers:
  broker 1001 at 172.18.0.4:30755 (controller)
 1 topics:
  topic "earthquakes" with 1 partitions:
    partition 0, leader 1001, replicas: 1001, isrs: 1001
You can see that Kafka consists of one broker and the topic earthquakes has been created.
To see some records that have been send to Kafka run the following command.
You can change the number of records to print via the -c parameter.
$ kafkacat -b 172.18.0.4:30968 -C -t earthquakes -c 3
{"time":"1950-01-02T15:14:37.960Z","latitude":-11.242,"longitude":165.006,"depth":15.0,"mag":6.12,"magType":"mw","nst":null,"gap":null,"dmin":null,"rms":null,"net":"iscgem","id":"iscgem895104","updated":"2022-04-26T18:23:01.545Z","place":"103 km WSW of Lata, Solomon Islands","type":"earthquake","horizontalError":null,"depthError":8.6,"magError":0.41,"magNst":null,"status":"reviewed","locationSource":"iscgem","magSource":"iscgem"}
{"time":"1950-01-03T02:51:55.410Z","latitude":17.533,"longitude":121.447,"depth":30.0,"mag":6.5,"magType":"mw","nst":null,"gap":null,"dmin":null,"rms":null,"net":"iscgem","id":"iscgem895106","updated":"2022-04-26T18:23:07.394Z","place":"6 km NNW of Tabuk, Philippines","type":"earthquake","horizontalError":null,"depthError":3.8,"magError":0.34,"magNst":null,"status":"reviewed","locationSource":"iscgem","magSource":"iscgem"}
{"time":"1950-01-03T11:06:28.640Z","latitude":-45.798,"longitude":-77.077,"depth":15.0,"mag":6.27,"magType":"mw","nst":null,"gap":null,"dmin":null,"rms":null,"net":"iscgem","id":"iscgem895109","updated":"2022-04-26T18:23:08.483Z","place":"Off the coast of Aisen, Chile","type":"earthquake","horizontalError":null,"depthError":25.0,"magError":0.2,"magNst":null,"status":"reviewed","locationSource":"iscgem","magSource":"iscgem"}
If you are interested on how many records have been produced to the Kafka topic so far, use the following command.
It will print the last record produced to the topic, which will be formatted with the pattern specified in the -f parameter.
The given pattern will print some metadata of the record.
$ kafkacat -b 172.18.0.4:30968 -C -t earthquakes -o -1 -c 1 \
    -f 'Topic %t / Partition %p / Offset: %o / Timestamp: %T\n'
Topic earthquakes / Partition 0 / Offset: 2670281 / Timestamp: 1660571644060
From the output you can see, that the last record was produced at the timestamp 1660571644060 which translates to Mo 15. Aug 15:54:04 CEST 2022 (using the command date -d @1660571644).
You can also see that it was the record number 2670281 send to this topic, so ~2.6 million records have been produced so far.
NiFi
NiFi is used to fetch earthquake-data from the internet and ingest it into Kafka. This demo includes a workflow ("process group") that downloads a large CSV file, converts it to individual JSON records and produces the records into Kafka.
View testdata-generation job
You can have a look at the ingestion job running in NiFi by opening the given nifi endpoint https from your stackablectl services list command output.
You have to use the endpoint from your command output, in this case it is https://172.18.0.3:32558. Open it with your favorite browser.
If you get a warning regarding the self-signed certificate generated by the Secret Operator (e.g. Warning: Potential Security Risk Ahead), you have to tell your browser to trust the website and continue.
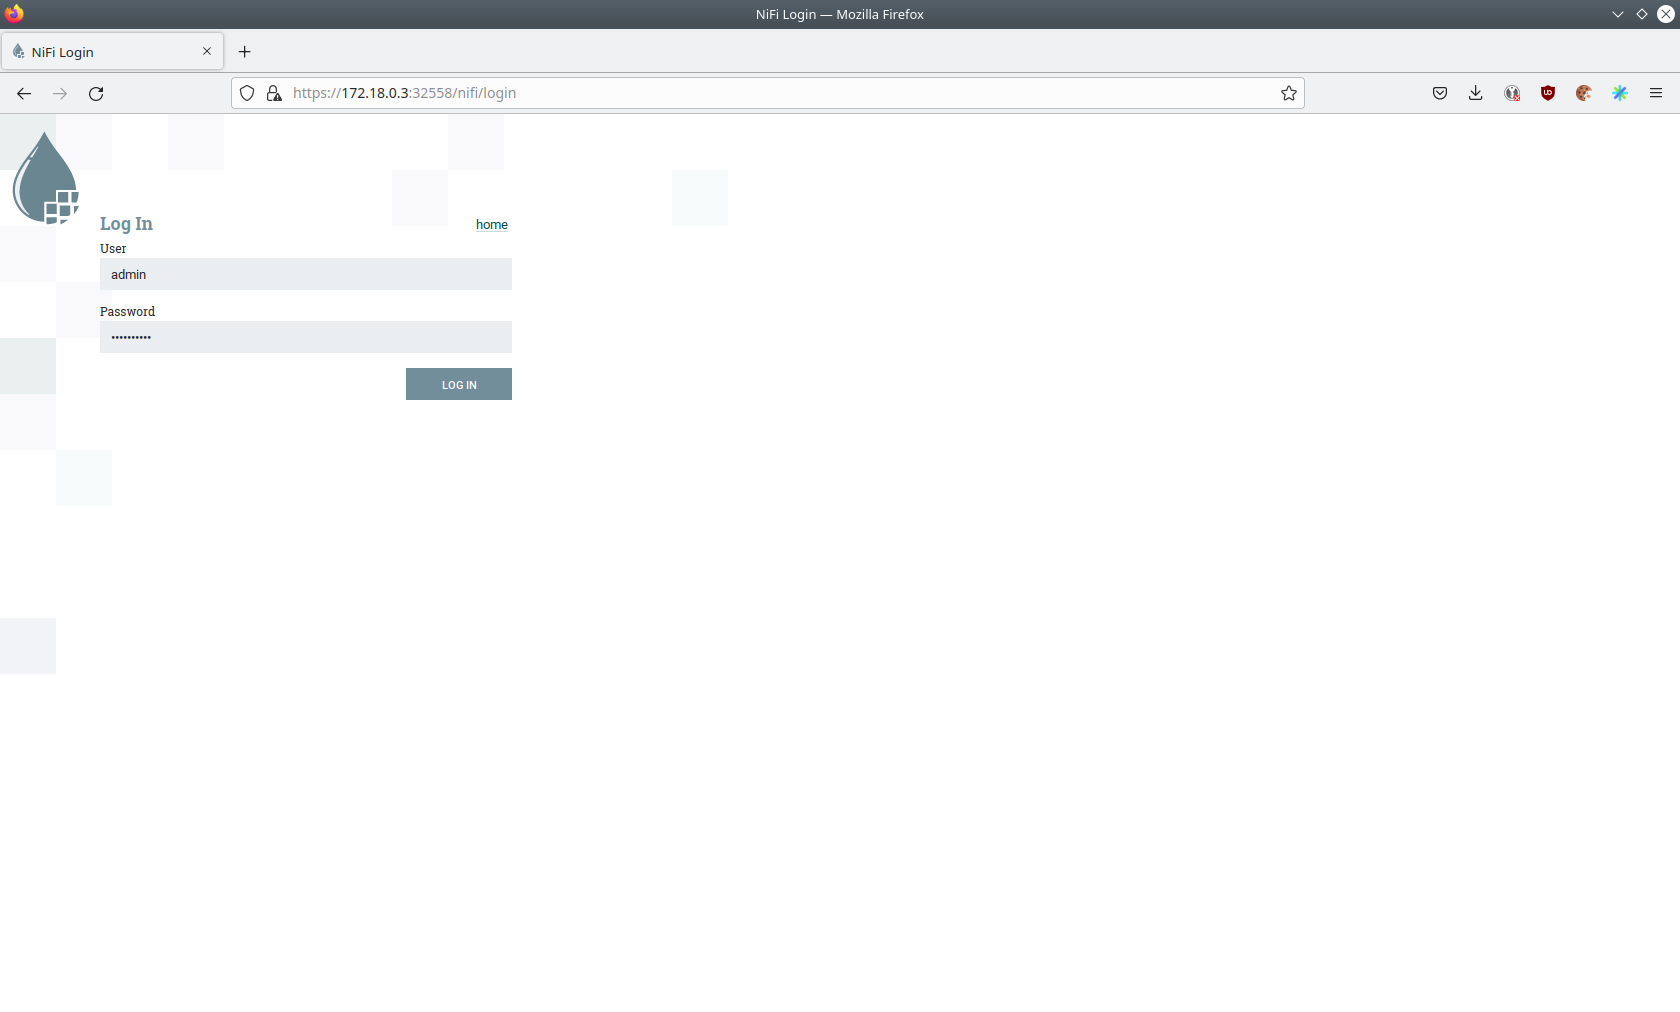
Log in with the username admin and password adminadmin.
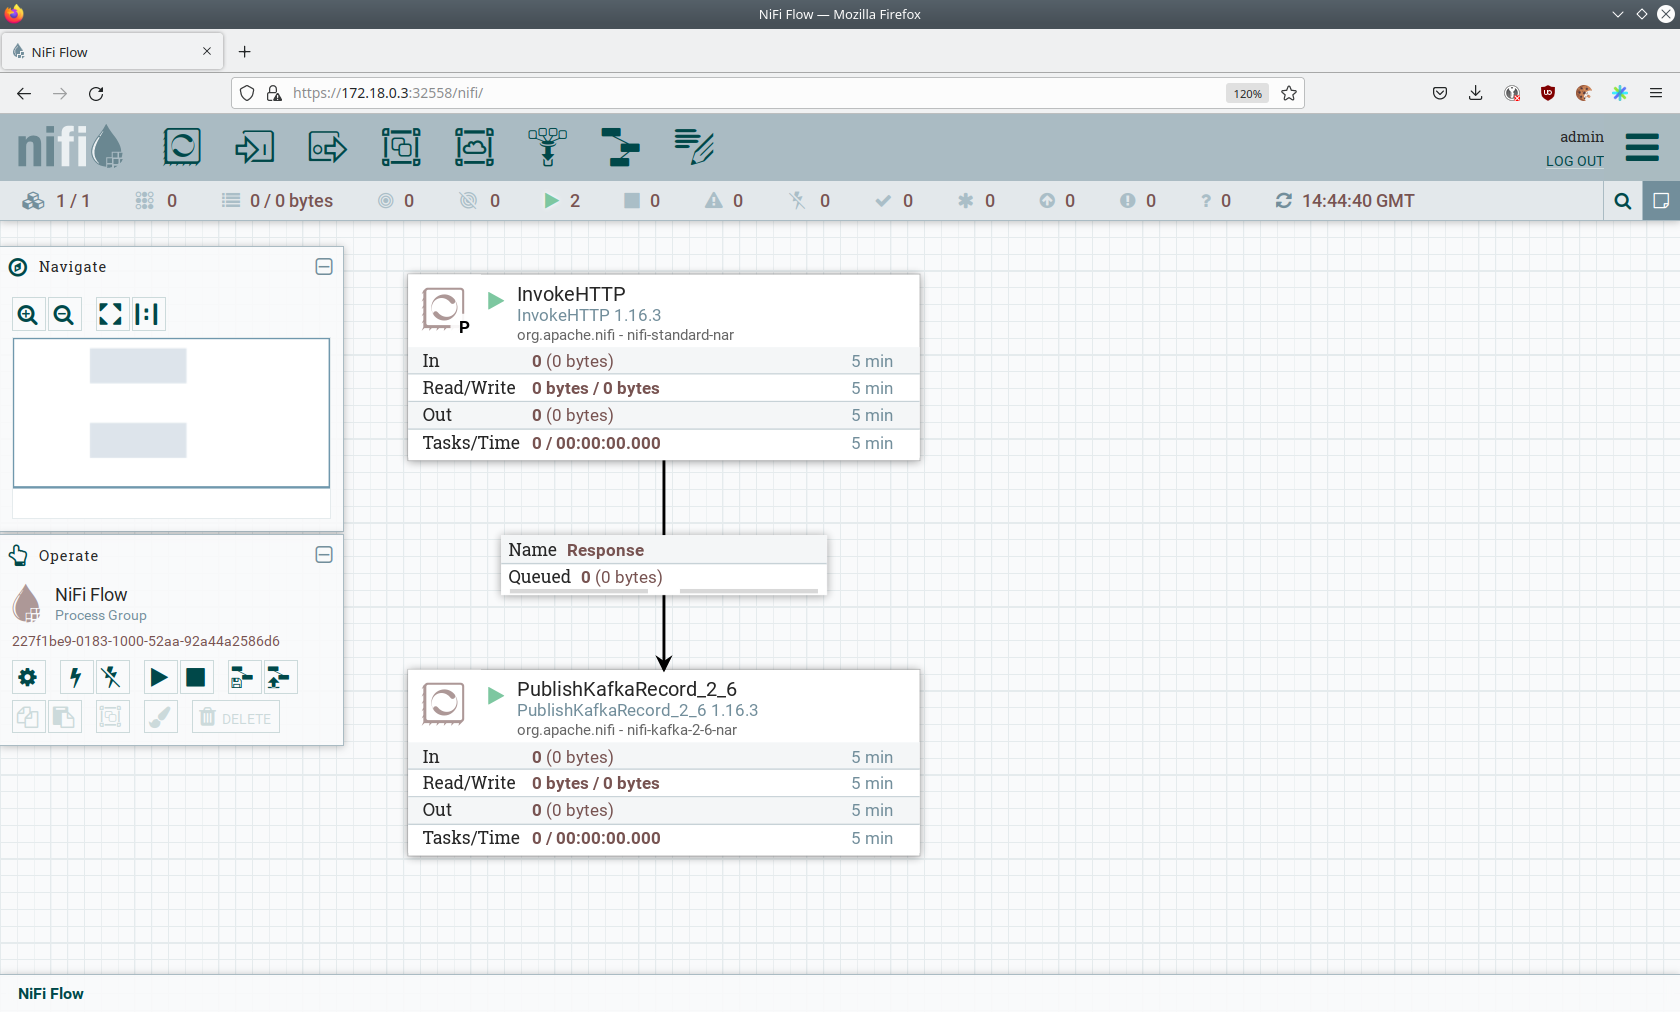
You can see the started ProcessGroup consisting of two processors.
The first one - InvokeHTTP fetches the CSV file from the Internet and put’s it into the queue to the next processor.
The second processor - PublishKafkaRecord_2_6 parses the CSV file, converts it to JSON records and writes them out into Kafka.
Double-click on the InvokeHTTP processor to show the processor details.
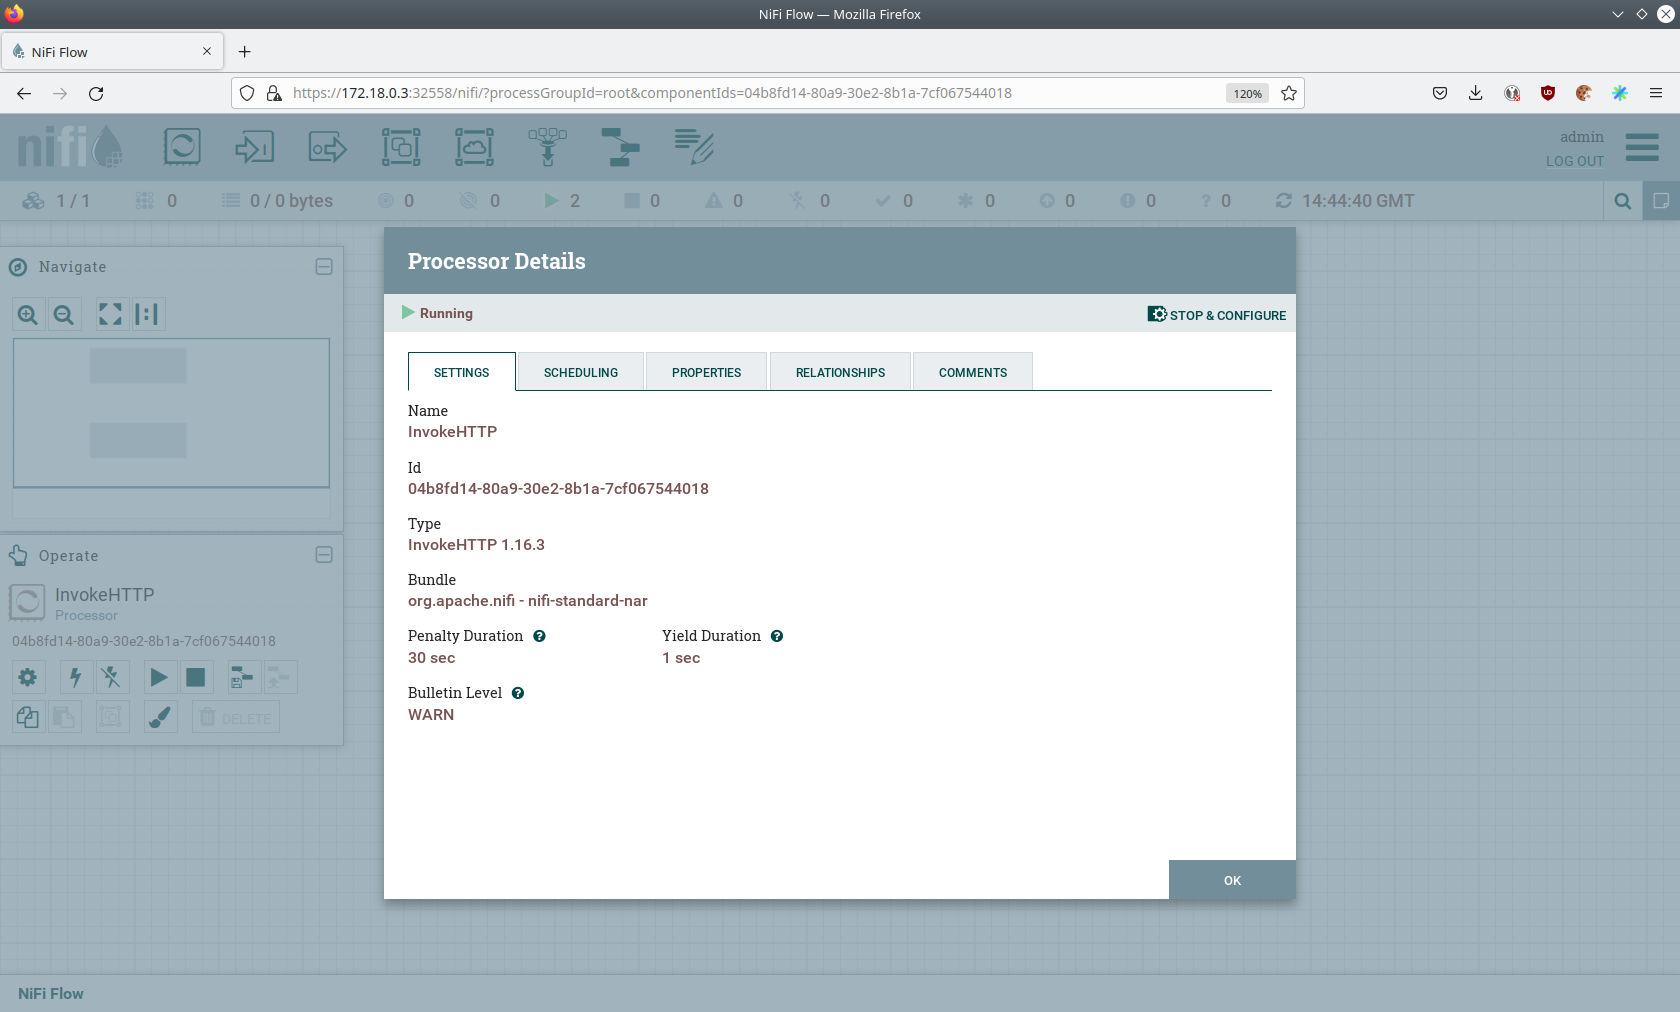
Head over to the Tab PROPERTIES.
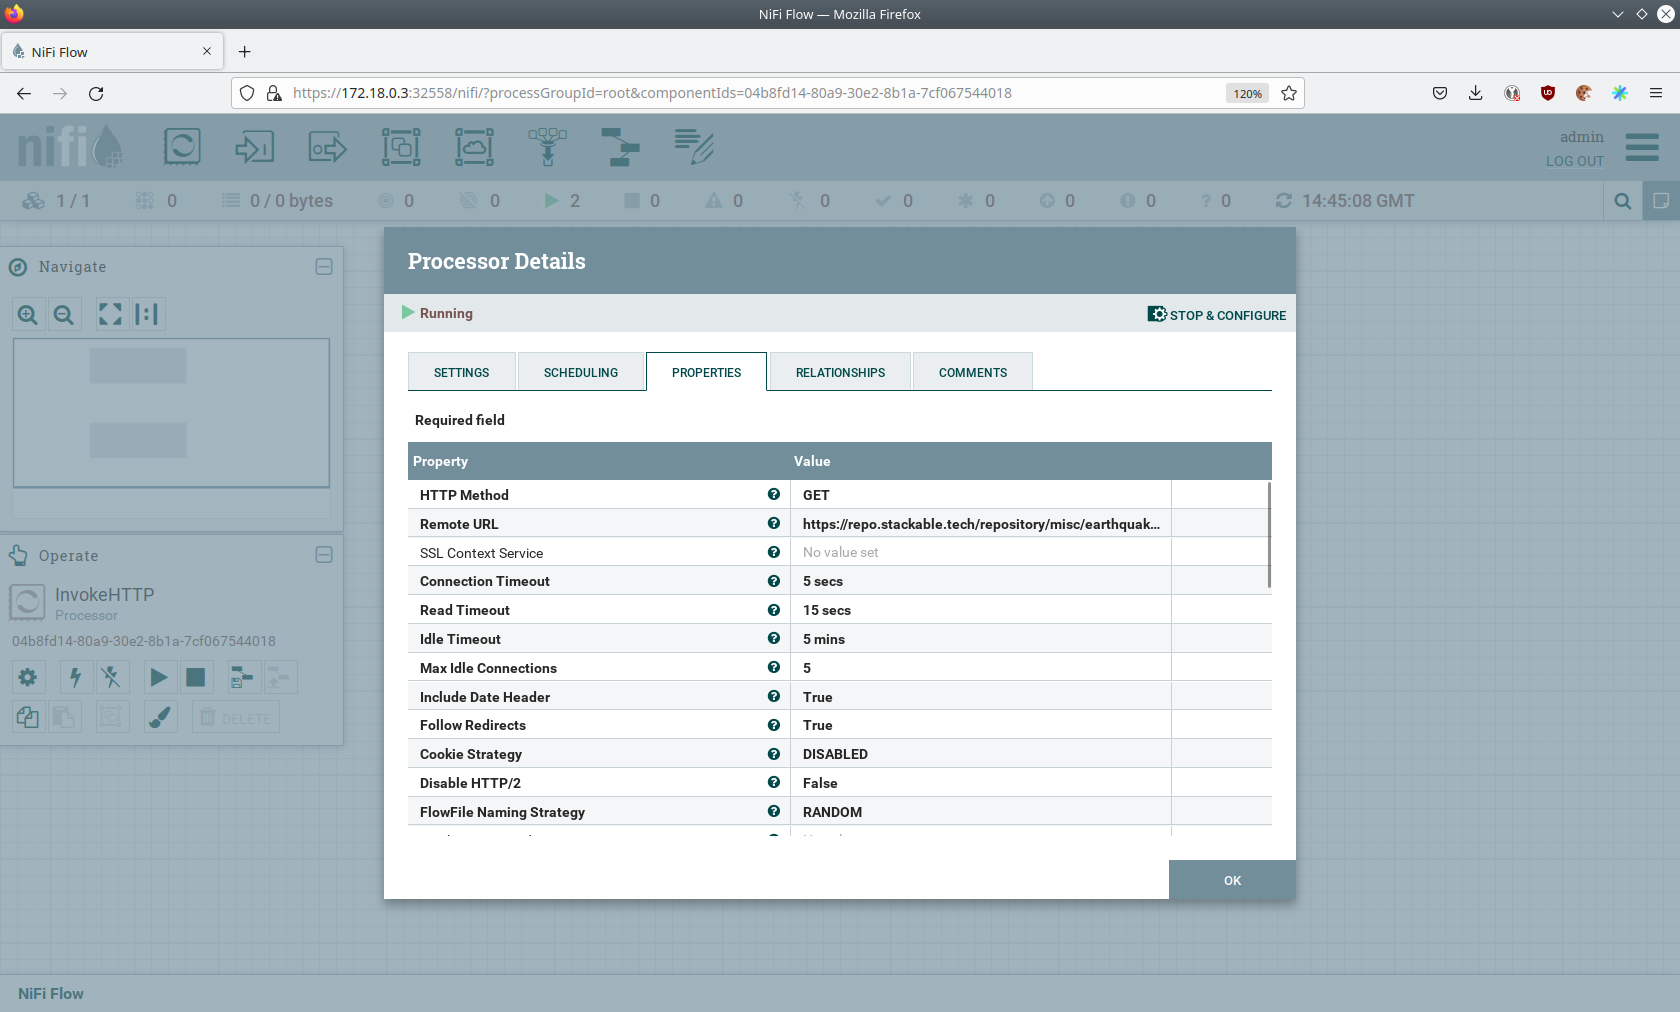
Here you can see the setting Remote URl, which specifies the download URL from where the CSV file is retrieved.
Close the processor details popup by clicking OK.
Afterwards double-click on the processor PublishKafkaRecord_2_6.
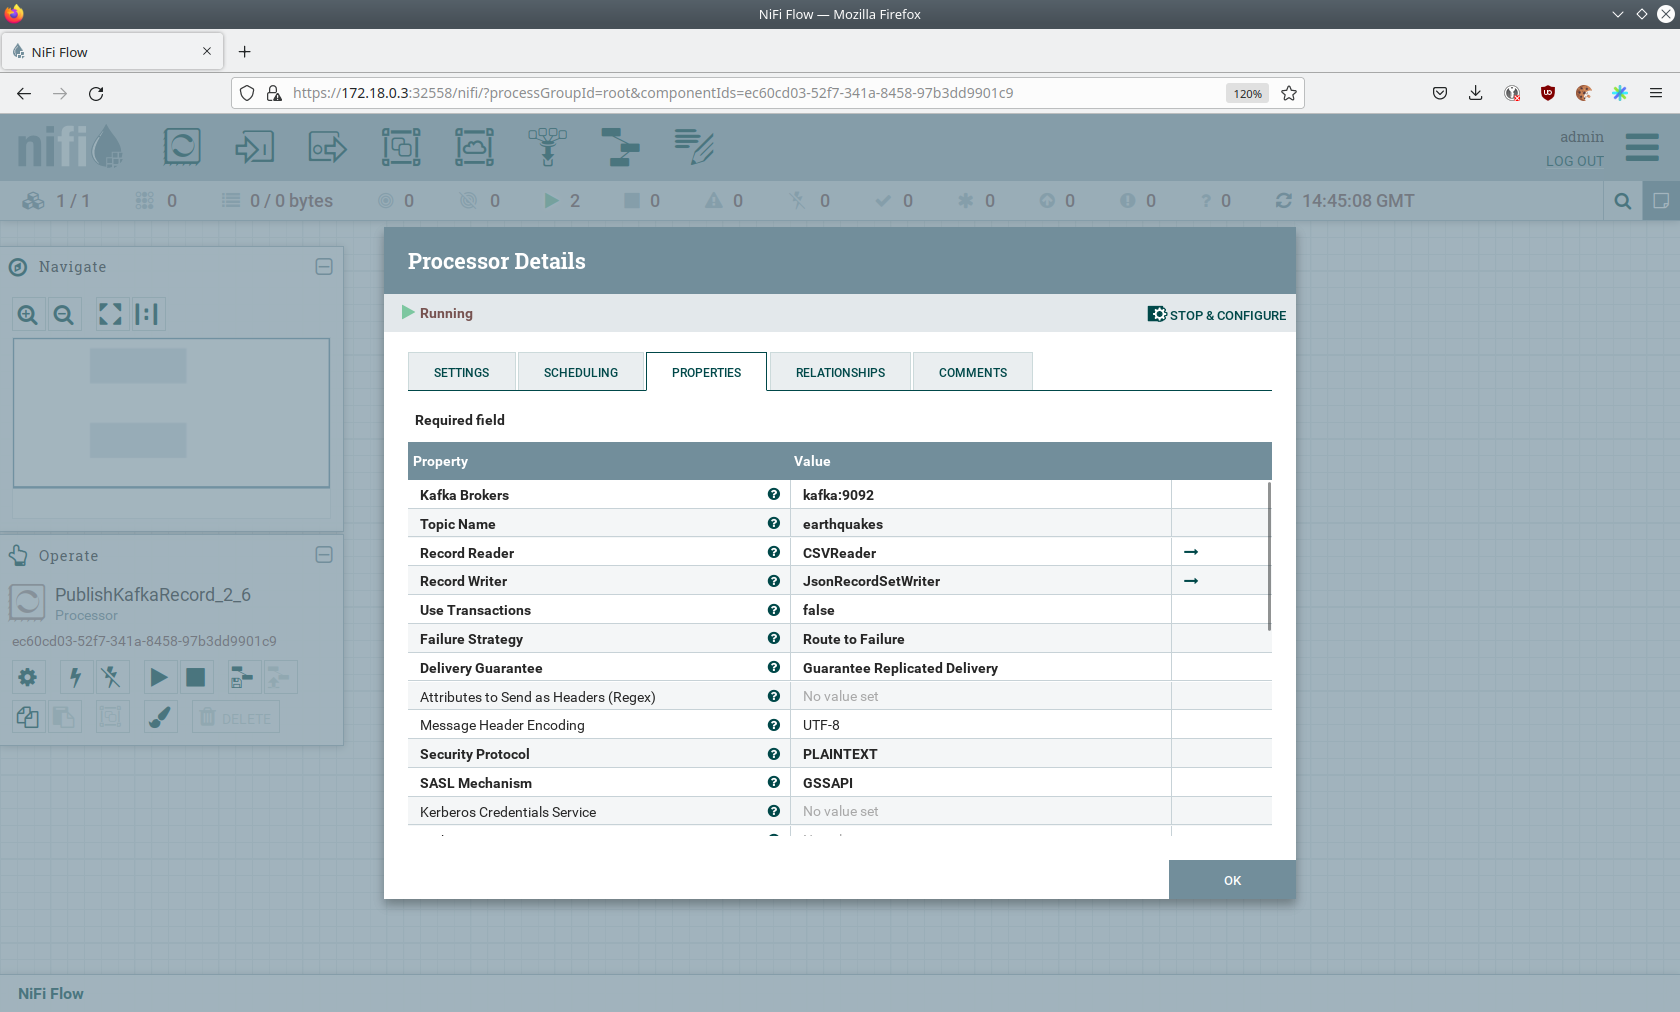
Within this processor the Kafka connection details - like broker addresses and topic name - are specified.
It uses the CSVReader to parse the downloaded CSV and the JsonRecordSetWriter to split it into individual JSON records before writing it out.
Druid
Druid is used to ingest the near real-time data from Kafka, store it and enable SQL access to it.
The demo has started an ingestion job reading earthquake records from the Kafka topic earthquakes and saving it into Druids deep storage.
The Druid deep storage is based on the S3 store provided by MinIO.
View ingestion job
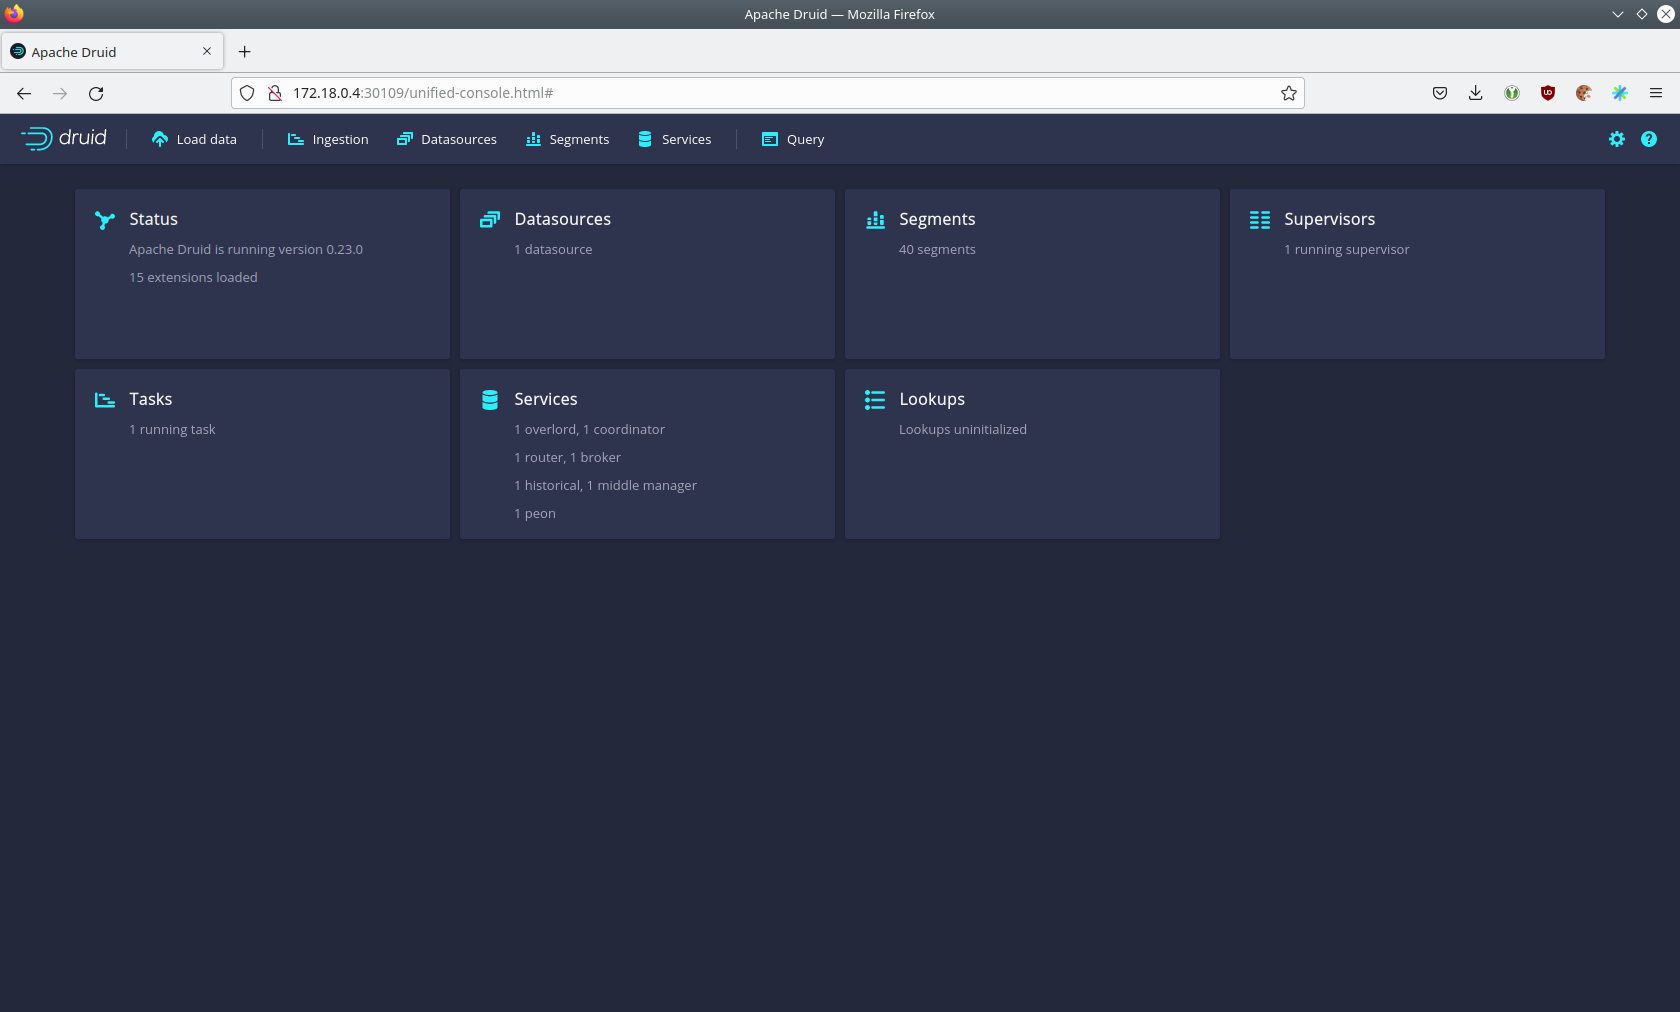
You can have a look at the ingestion job running in Druid by opening the given druid endpoint router-http from your stackablectl services list command output (http://172.18.0.4:30109 in this case).
By clicking on Ingestion at the top you can see the running ingestion jobs.
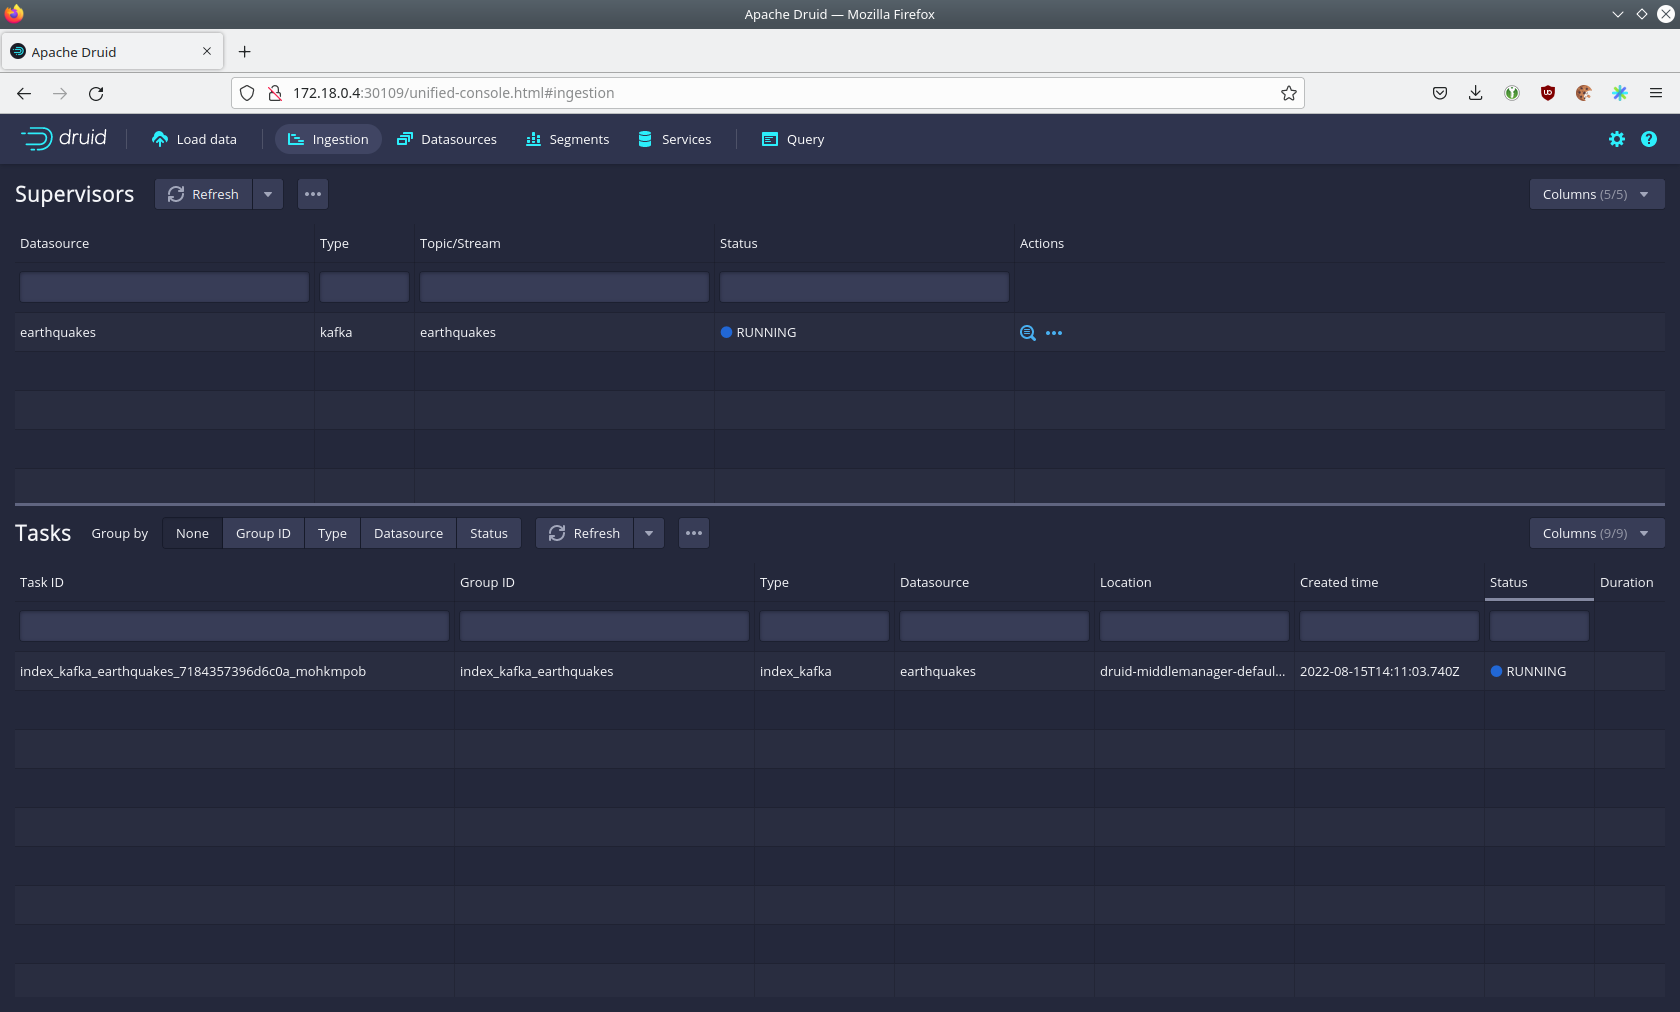
After clicking on the magnification glass to the right side of the RUNNING supervisor you can see additional information.
On the tab Statistics on the left you can see the number of processed records as well as the number of errors.
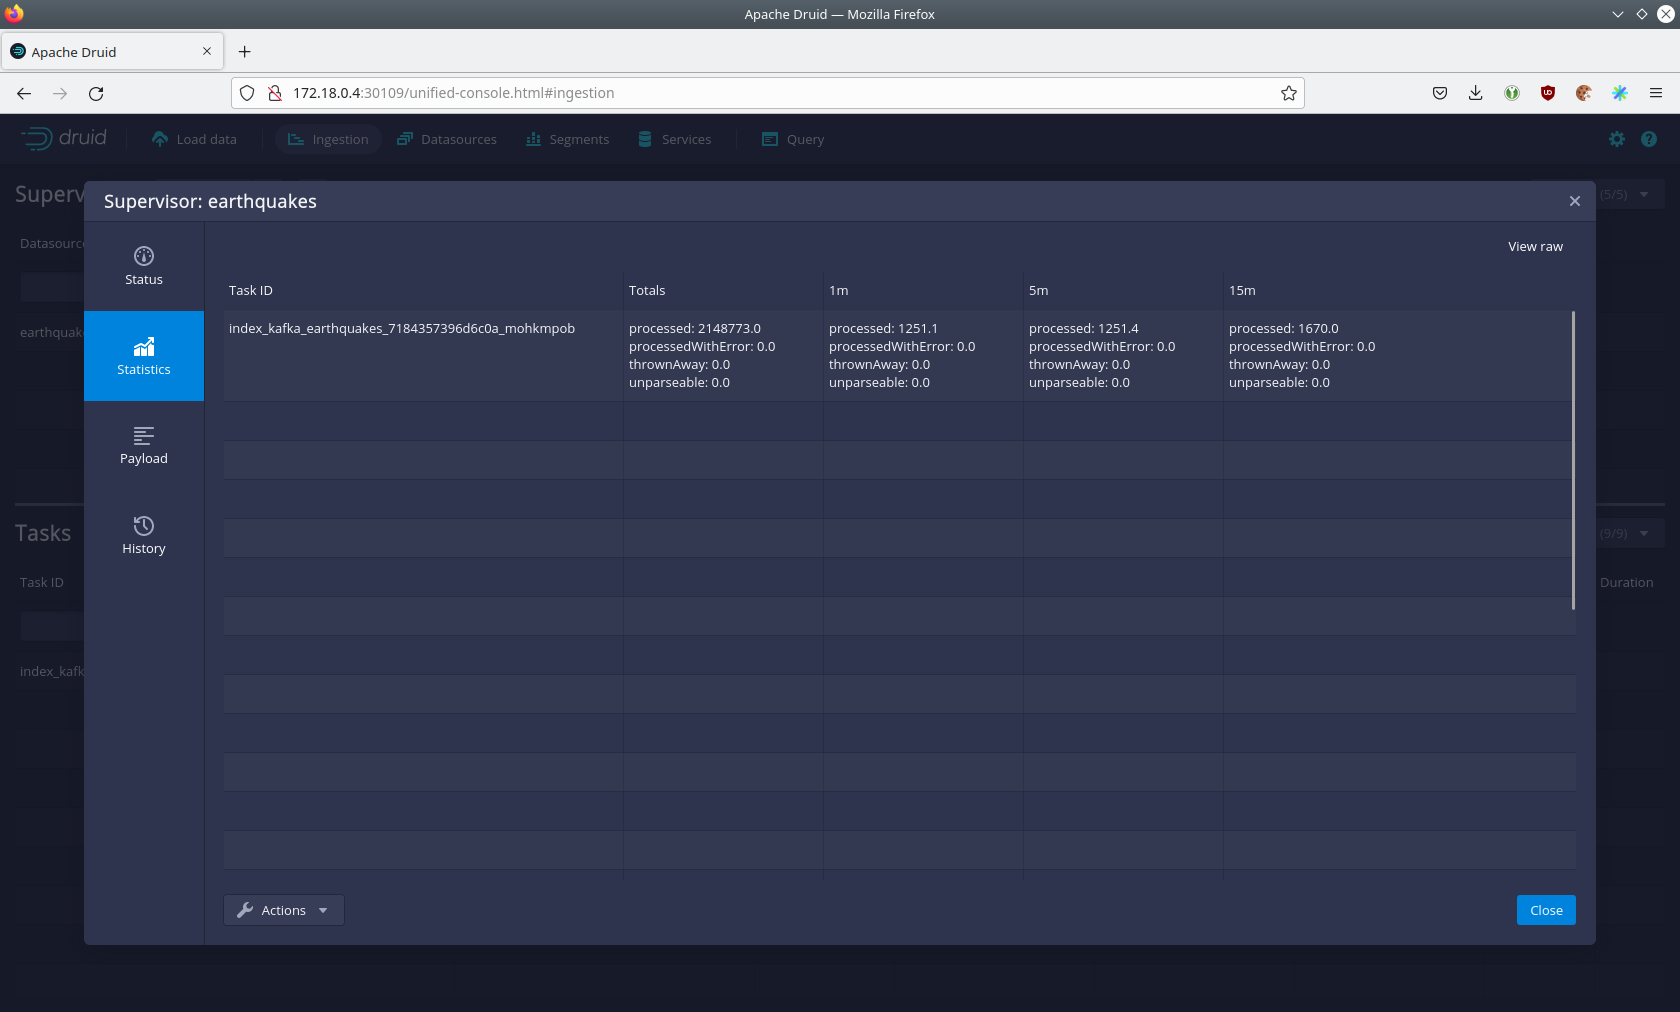
The statistics show that Druid is currently ingesting 1251 records/s and has ingested 2.1 million records so far.
All records have been ingested successfully, which is indicated by having no processWithError, thrownAway or unparseable records.
Query the data source
The started ingestion job has automatically created the Druid data source earthquakes.
You can see the available data sources by clicking on Datasources at the top.
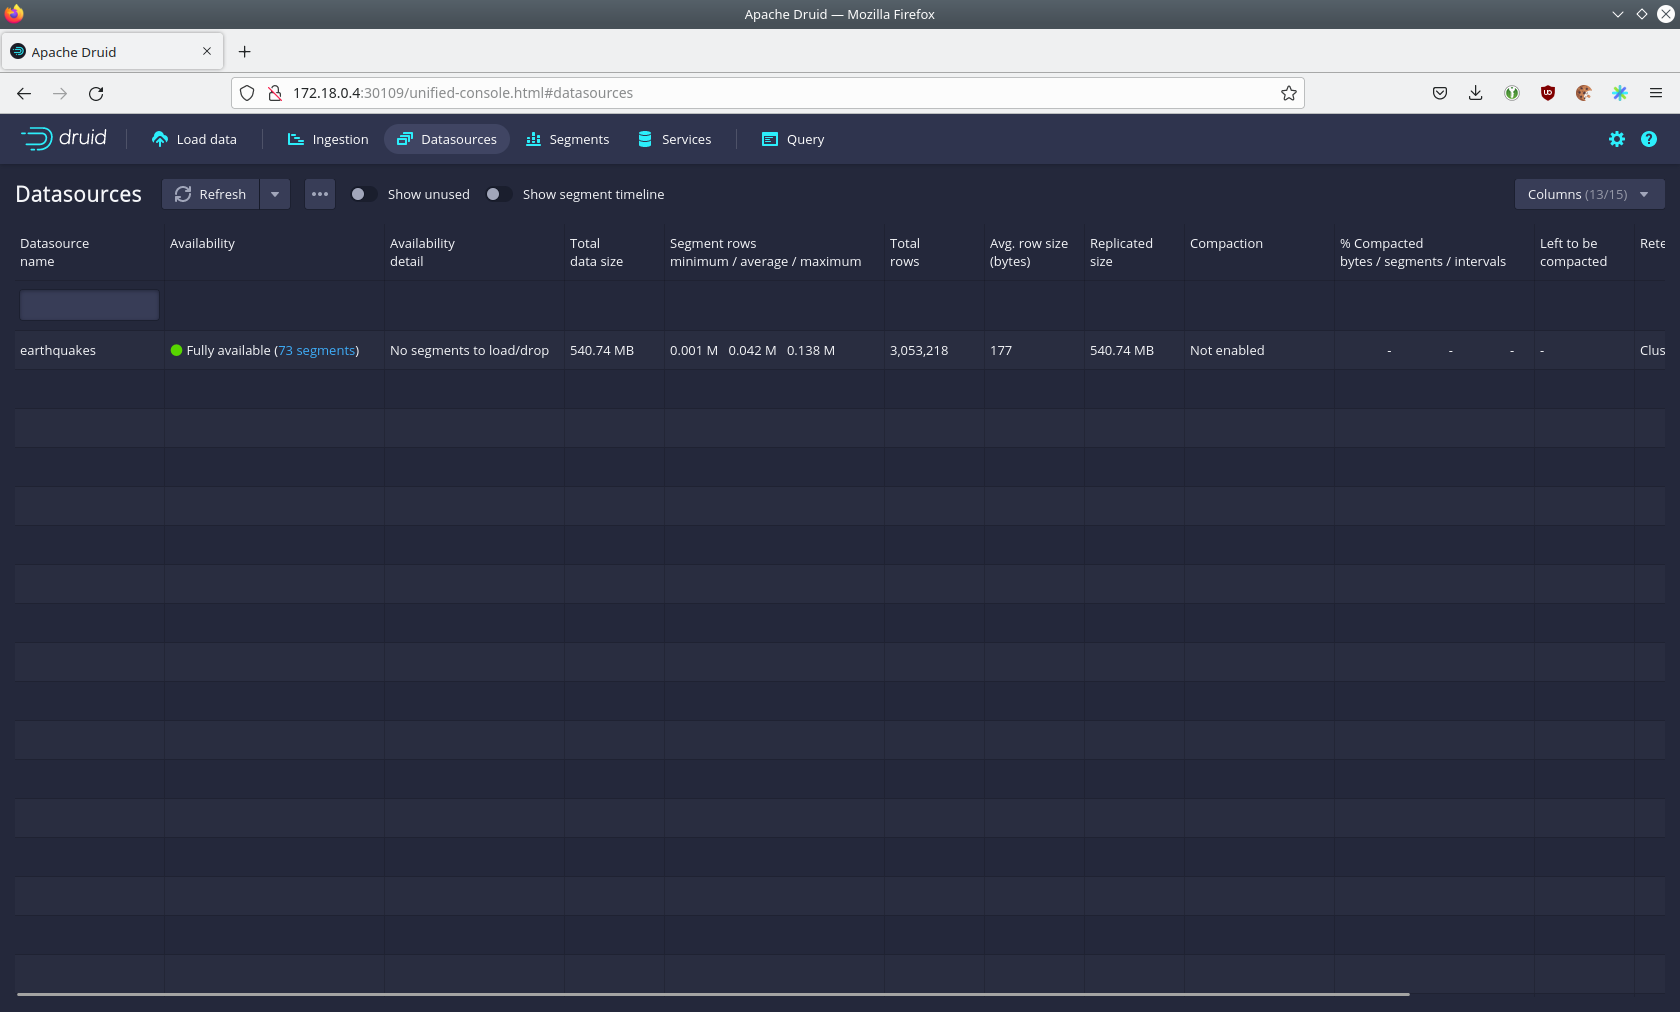
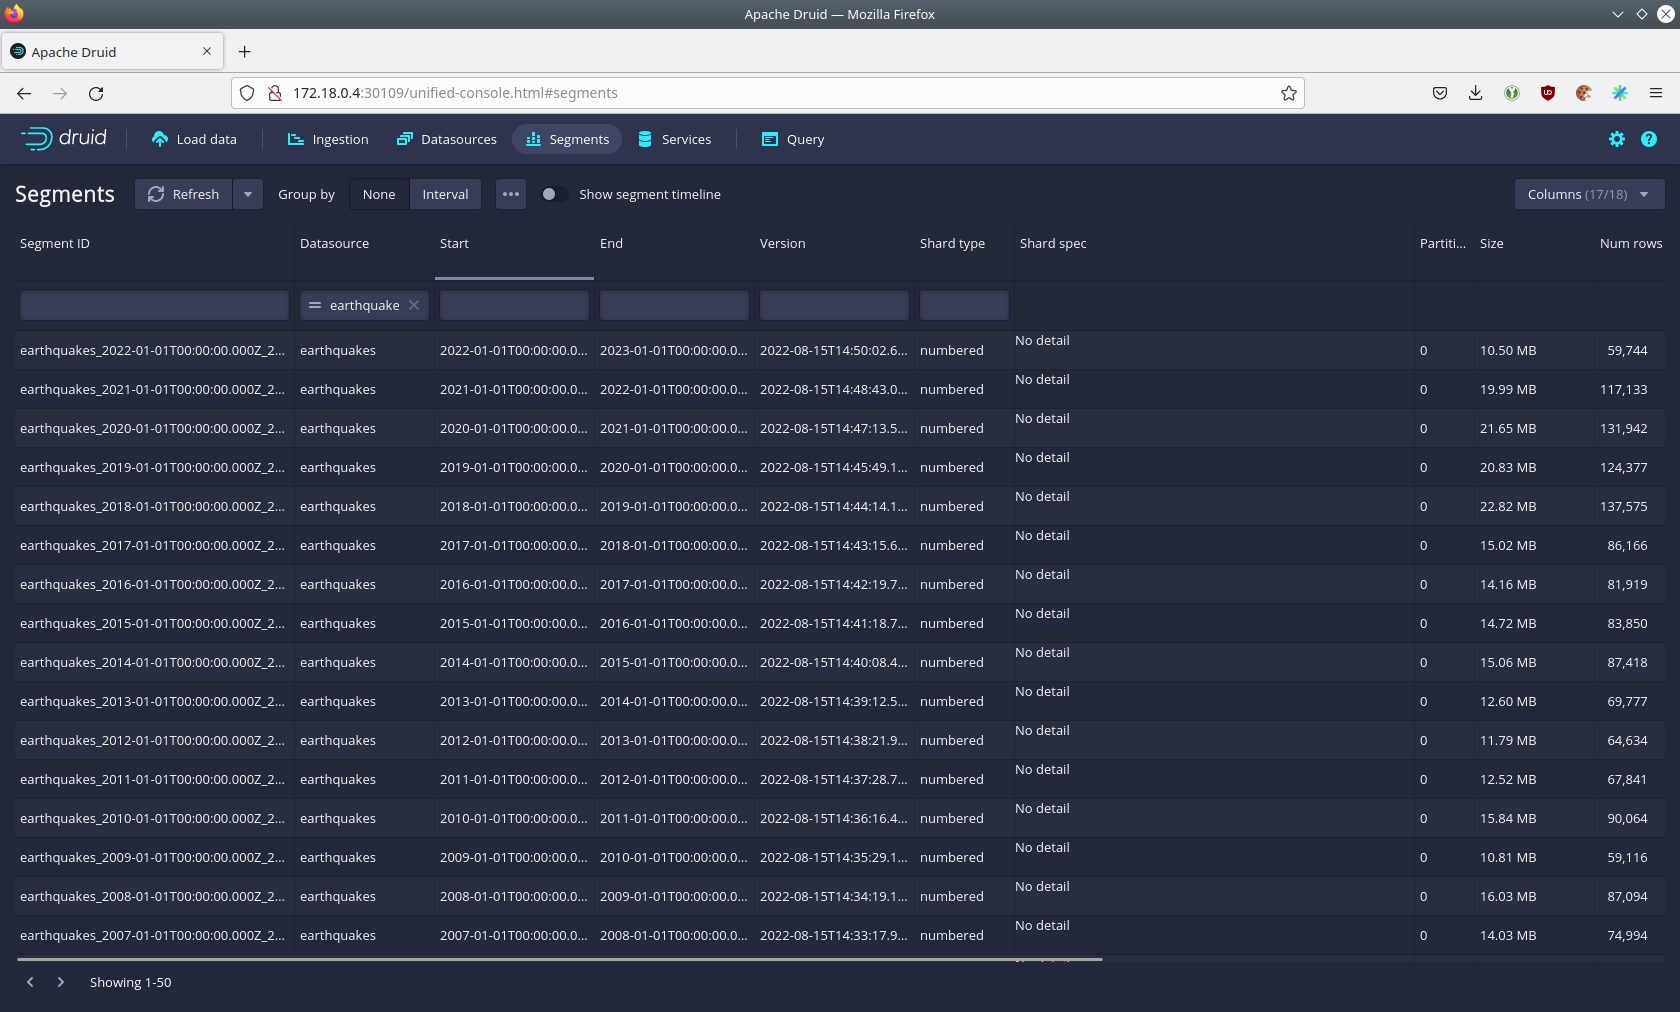
By clicking on the earthquakes data source you can see the segments the data source consists of.
In this case the earthquakes data source is partitioned by the year of the earthquake, resulting in 73 segments.
Druid offers a web-based way of querying the data sources via SQL.
To achieve this you first have to click on Query at the top.
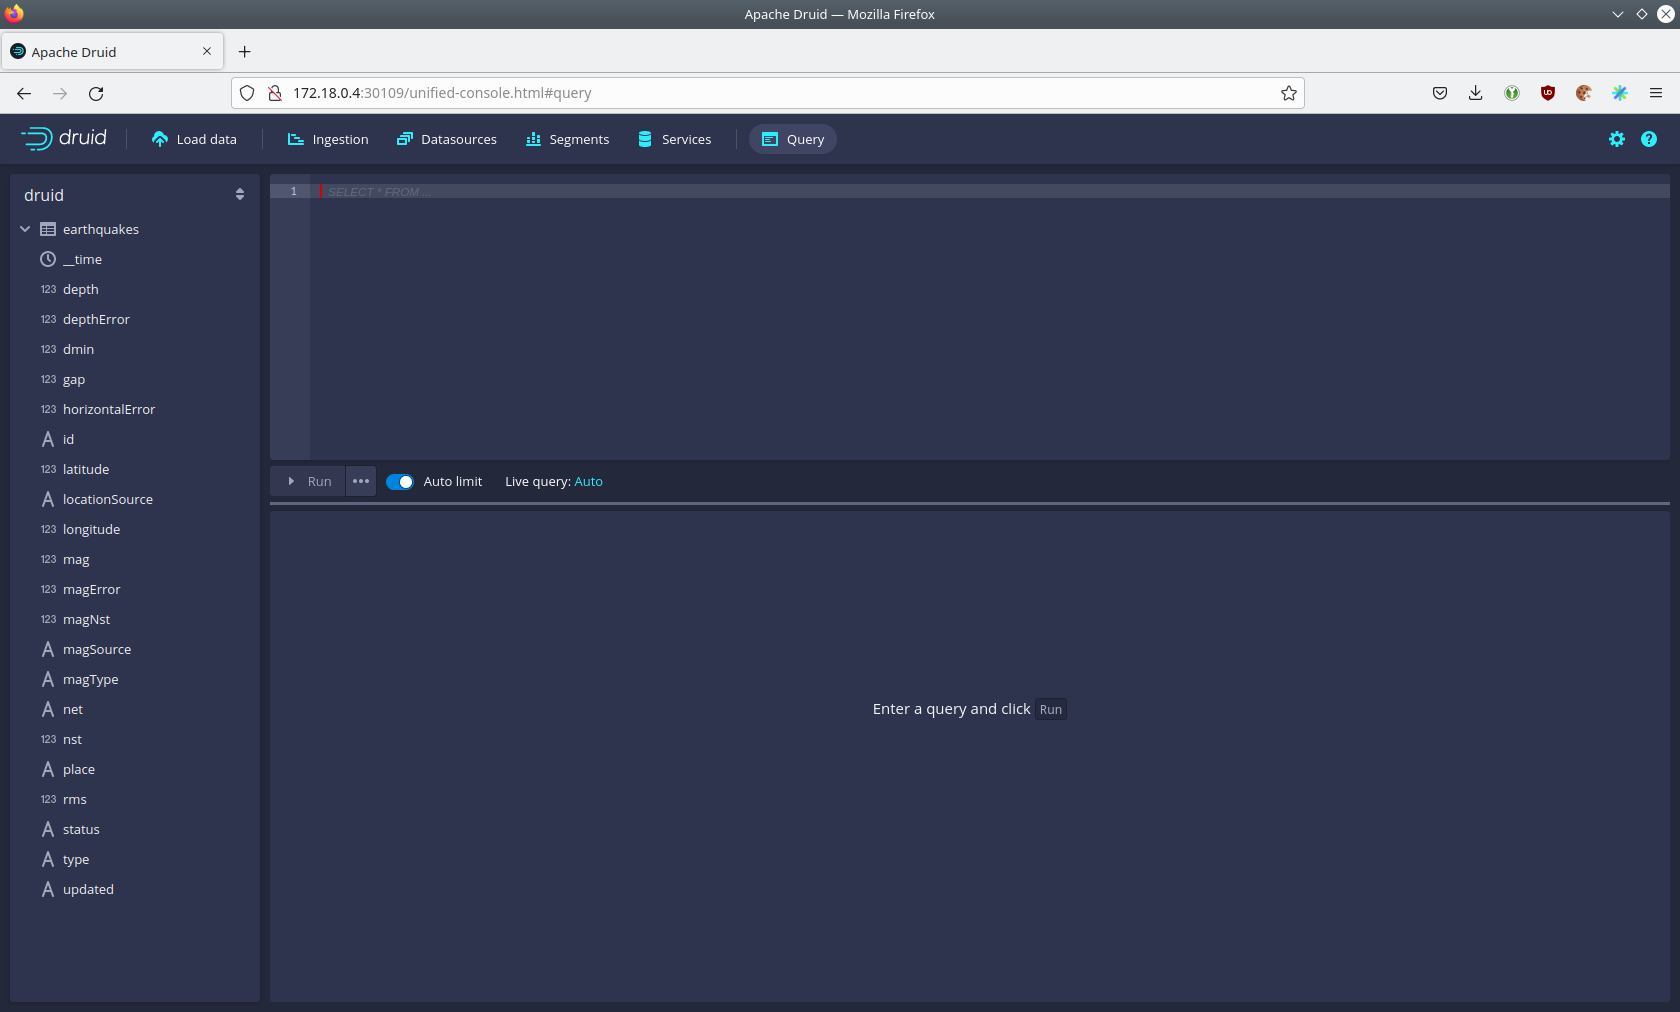
You can now enter any arbitrary SQL statement, to e.g. list 10 earthquakes run
select * from earthquakes limit 10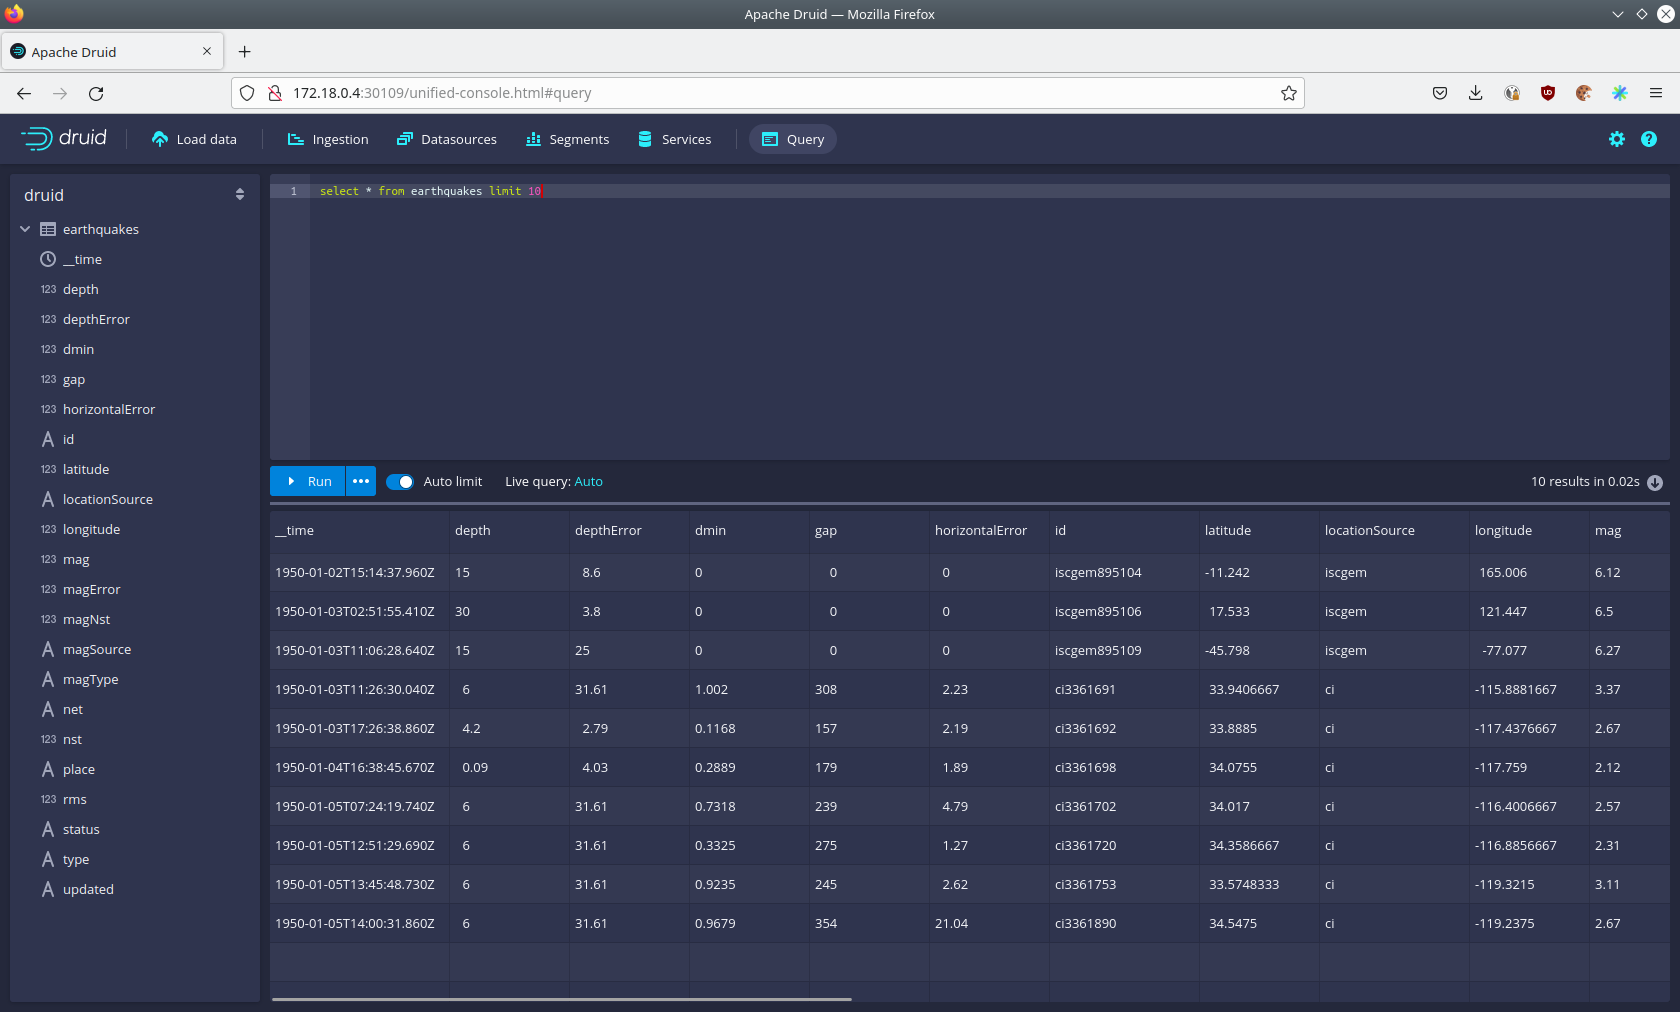
To count the number of earthquakes per year run
select
  time_format(__time, 'YYYY') as "year",
  count(*) as earthquakes
from earthquakes
group by 1
order by 1 desc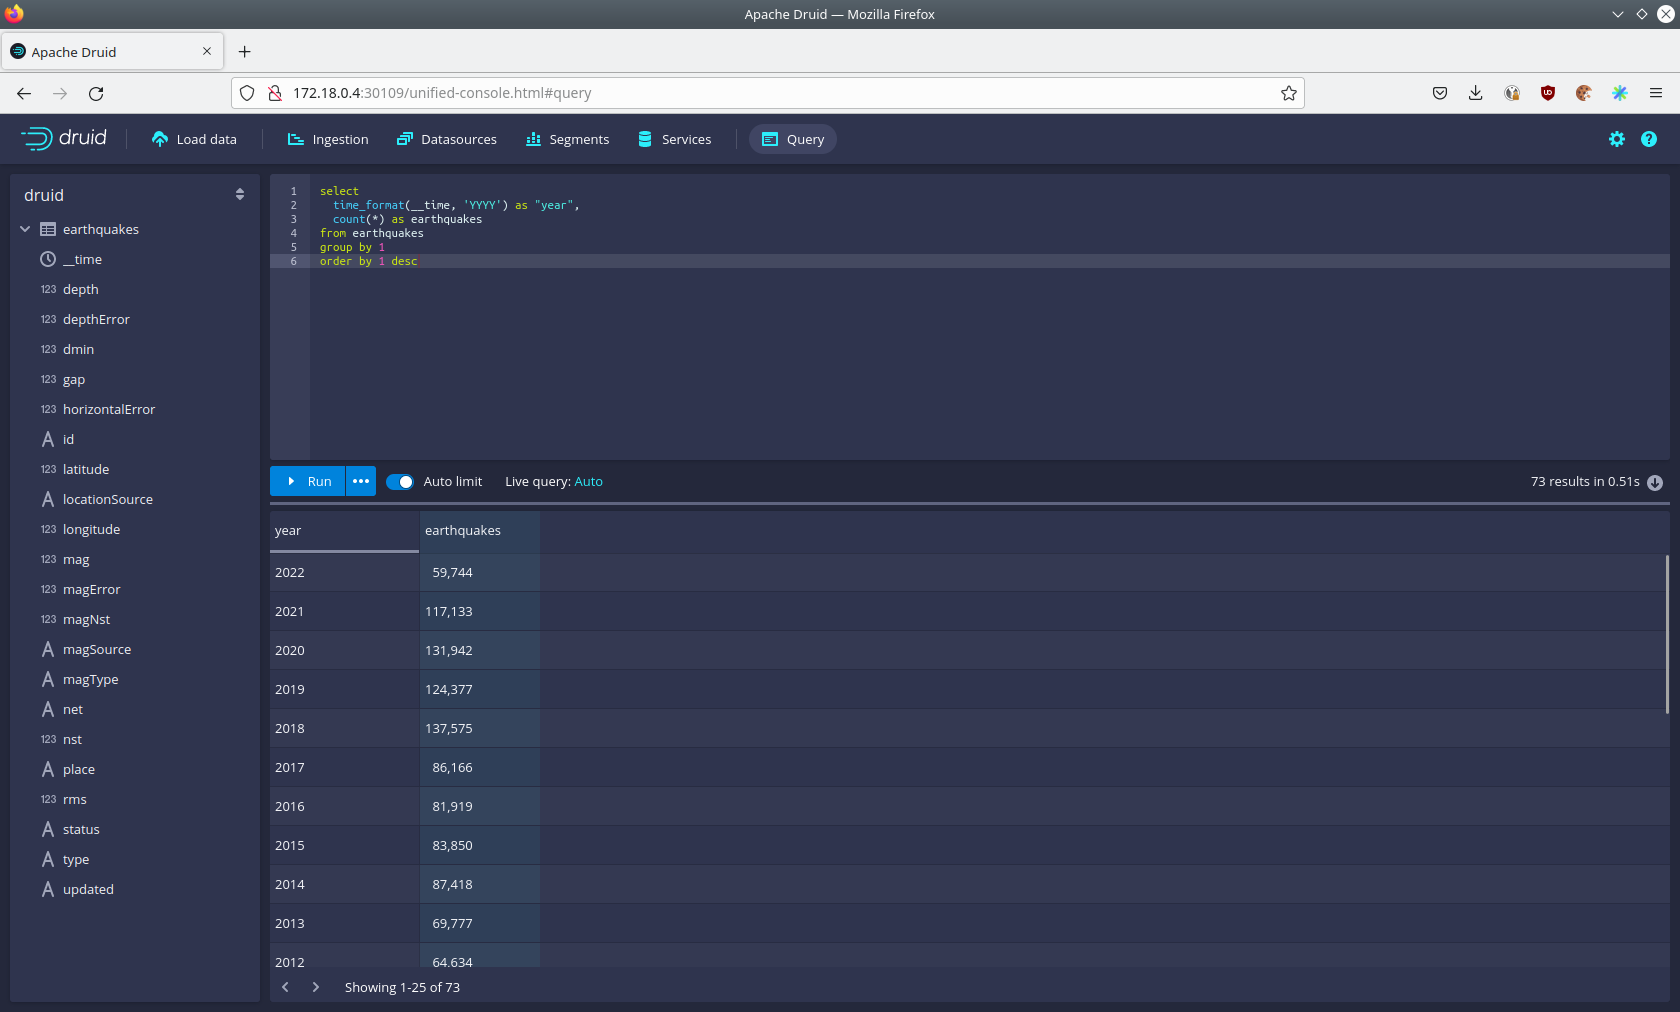
Superset
Superset provides the ability to execute SQL queries and build dashboards.
Open the superset endpoint external-superset in your browser (http://172.18.0.3:32108 in this case).
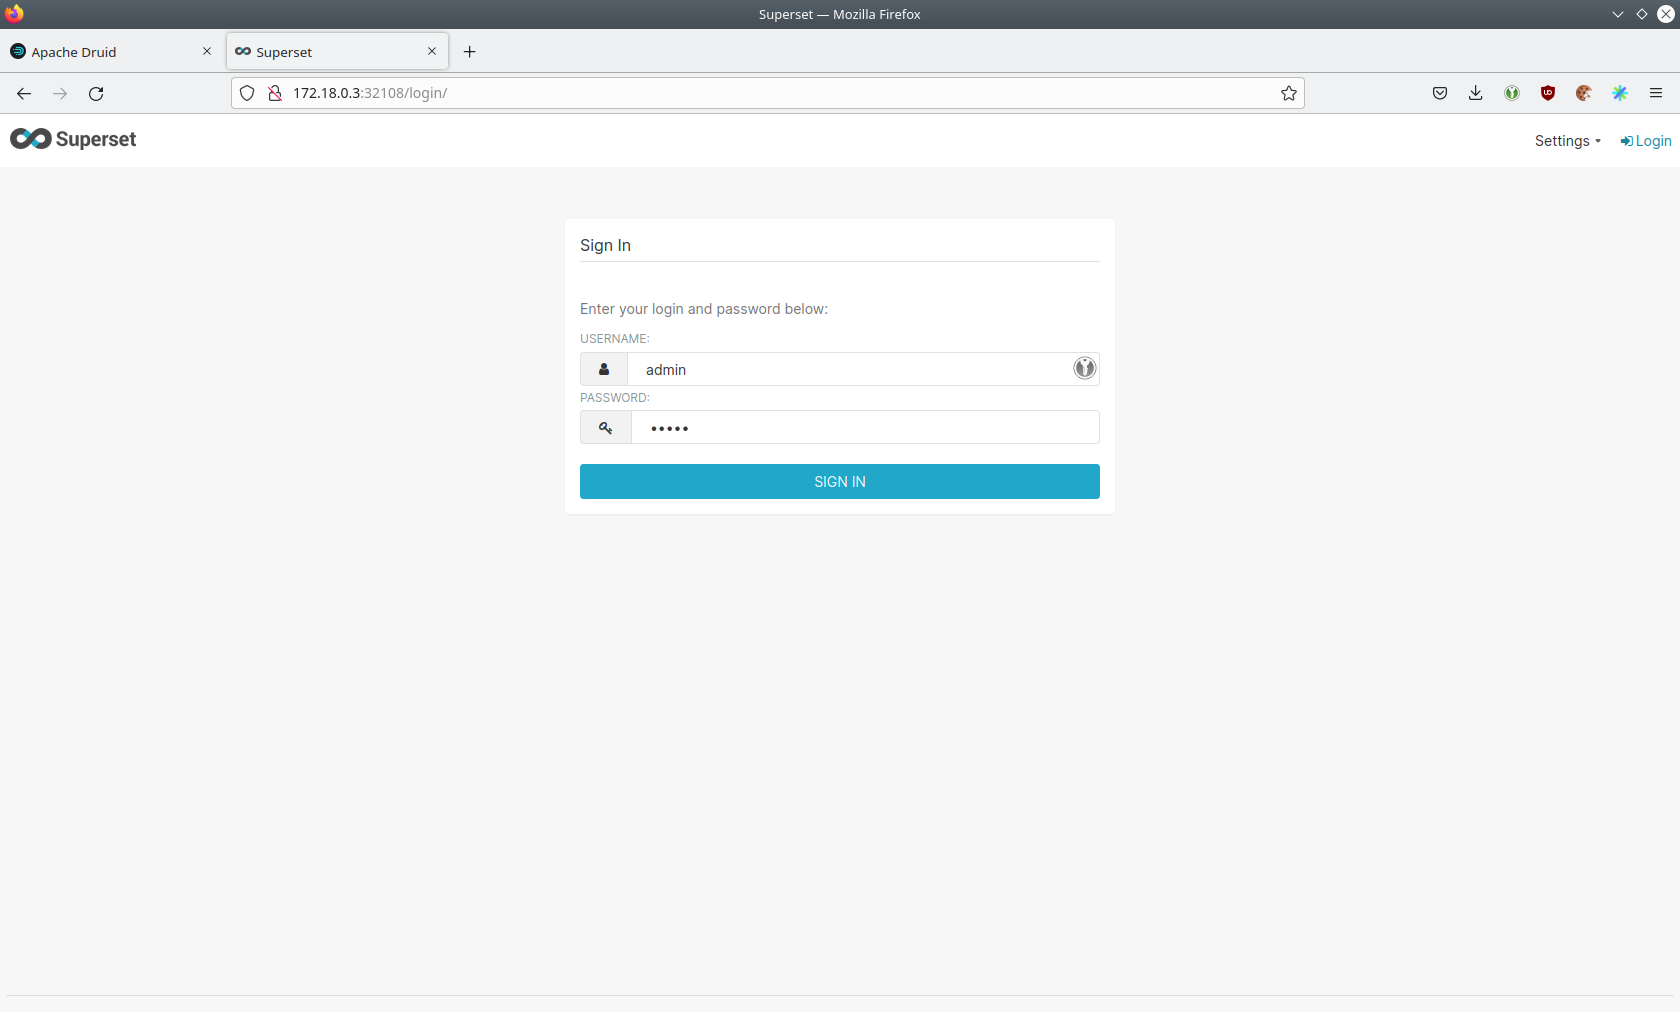
Log in with the username admin and password adminadmin.
View dashboard
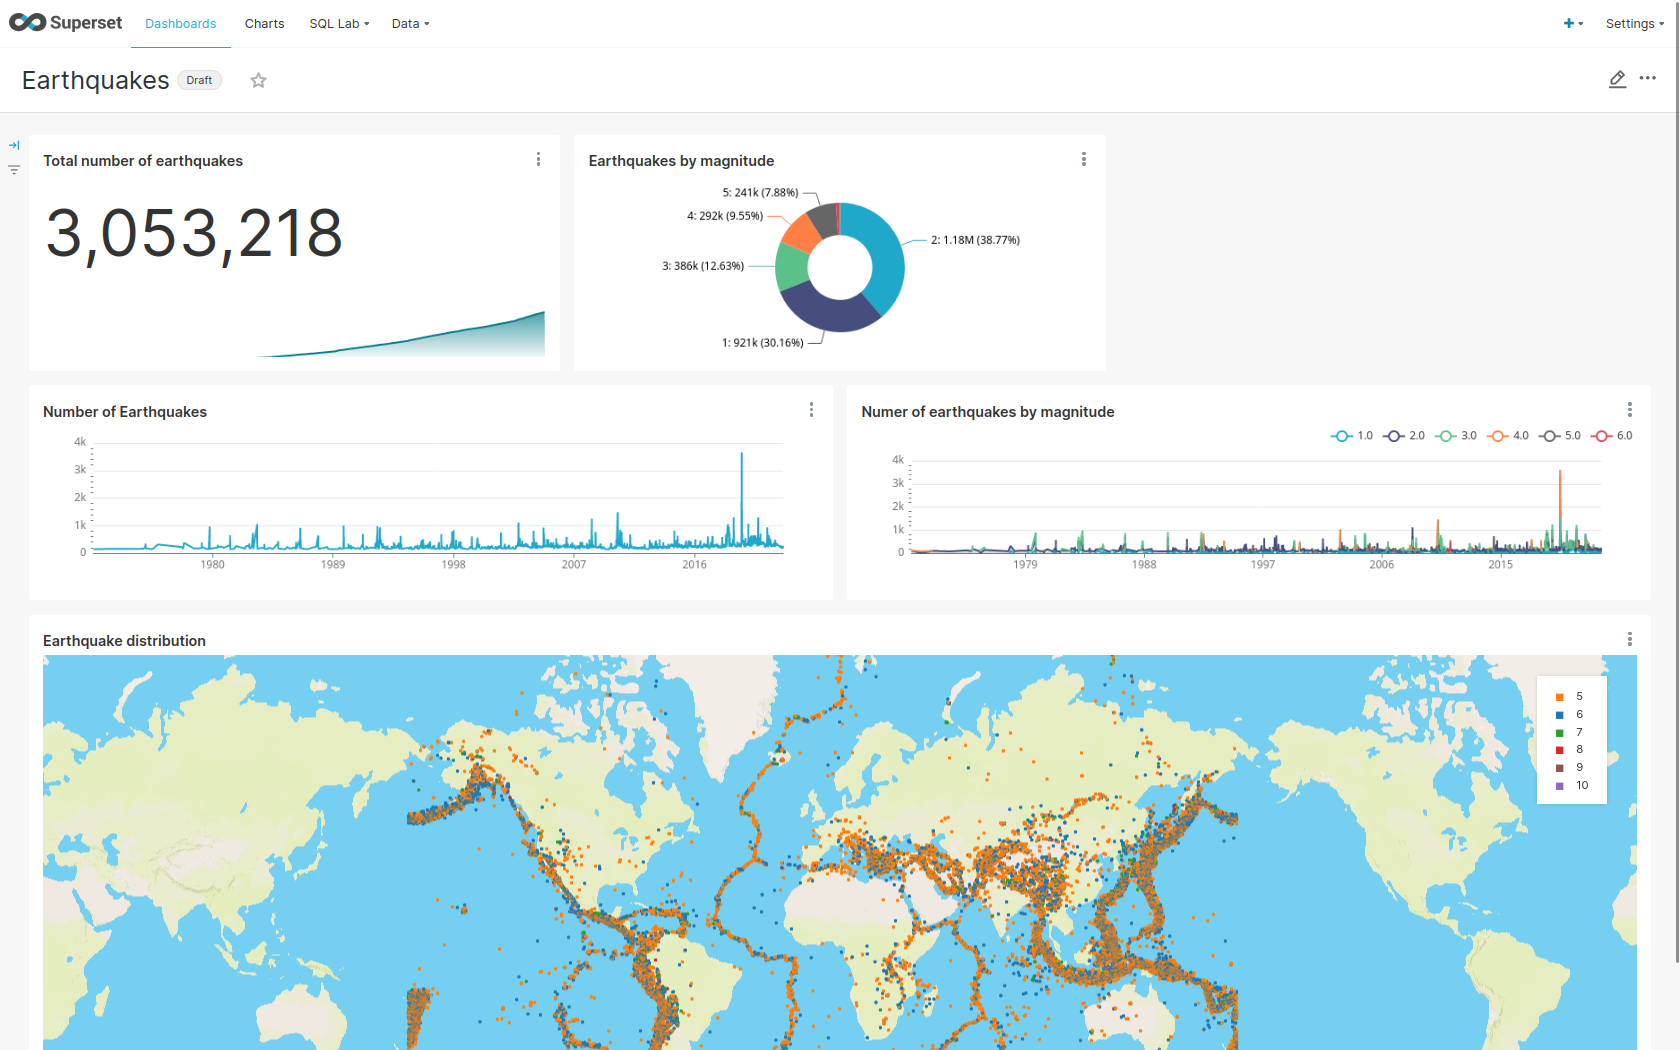
The demo has created a Dashboard to visualize the earthquake data.
To open it click on the tab Dashboards at the top.
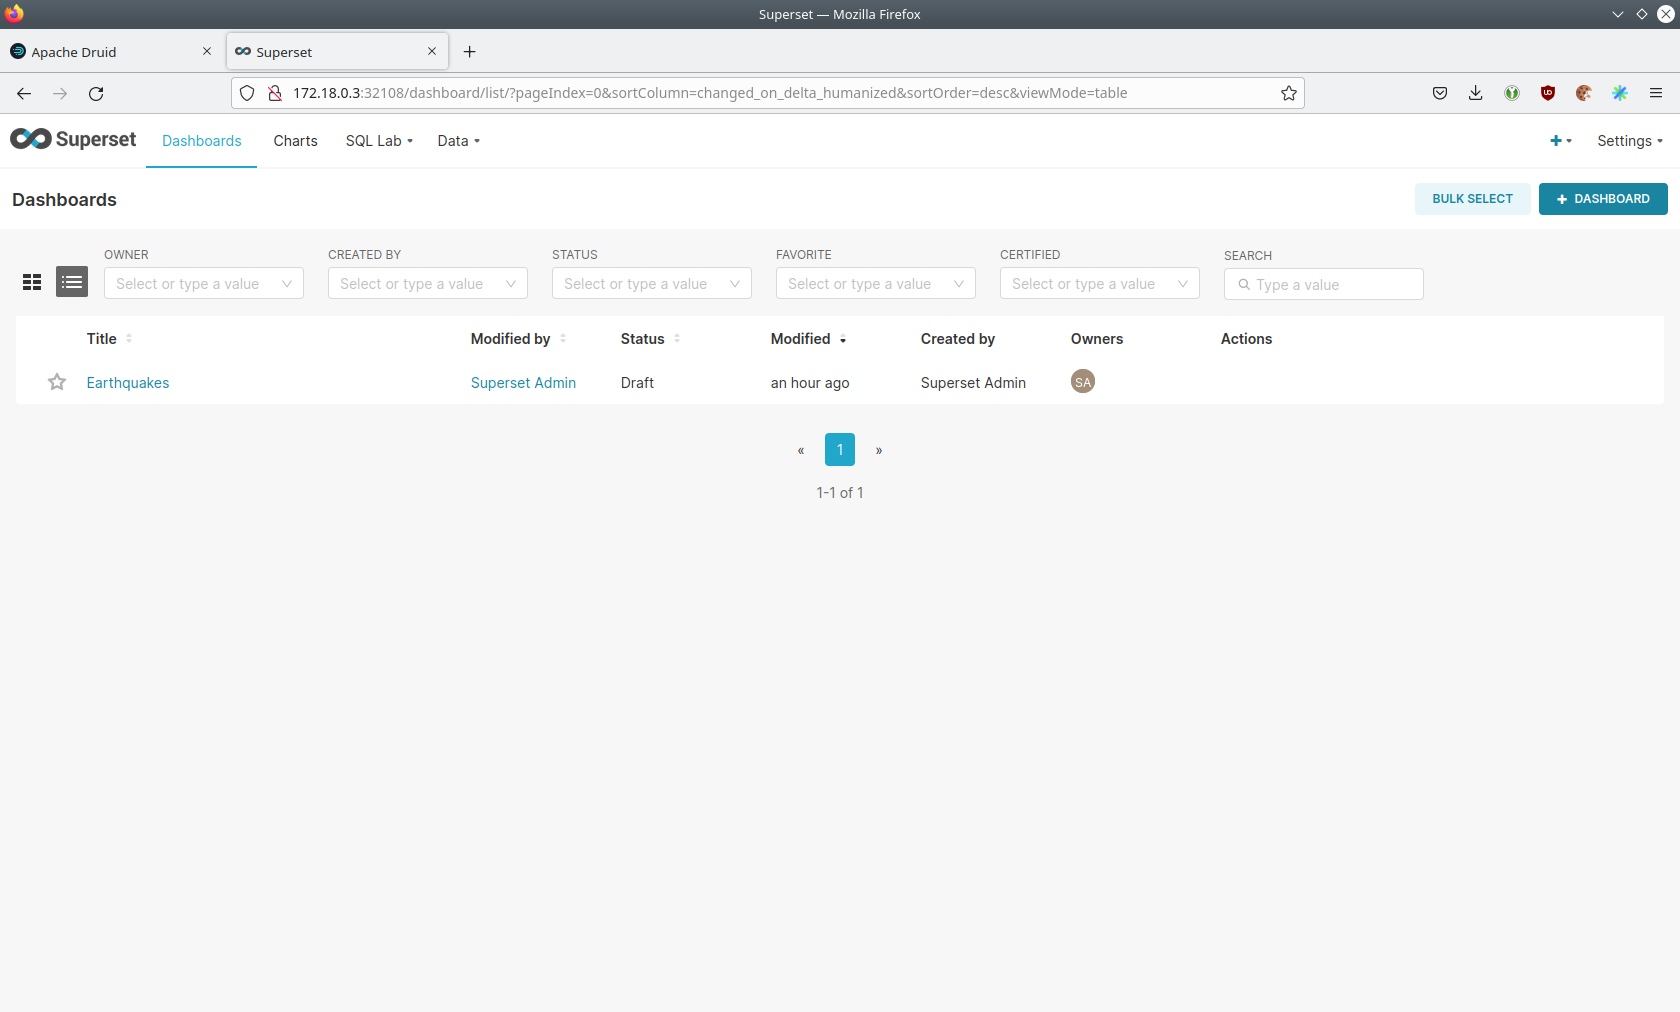
Click on the dashboard called Earthquakes.
It might take some time until the dashboards renders all the included charts.
View charts
The dashboard Earthquakes consists of multiple charts.
To list the charts click on the tab Charts at the top.
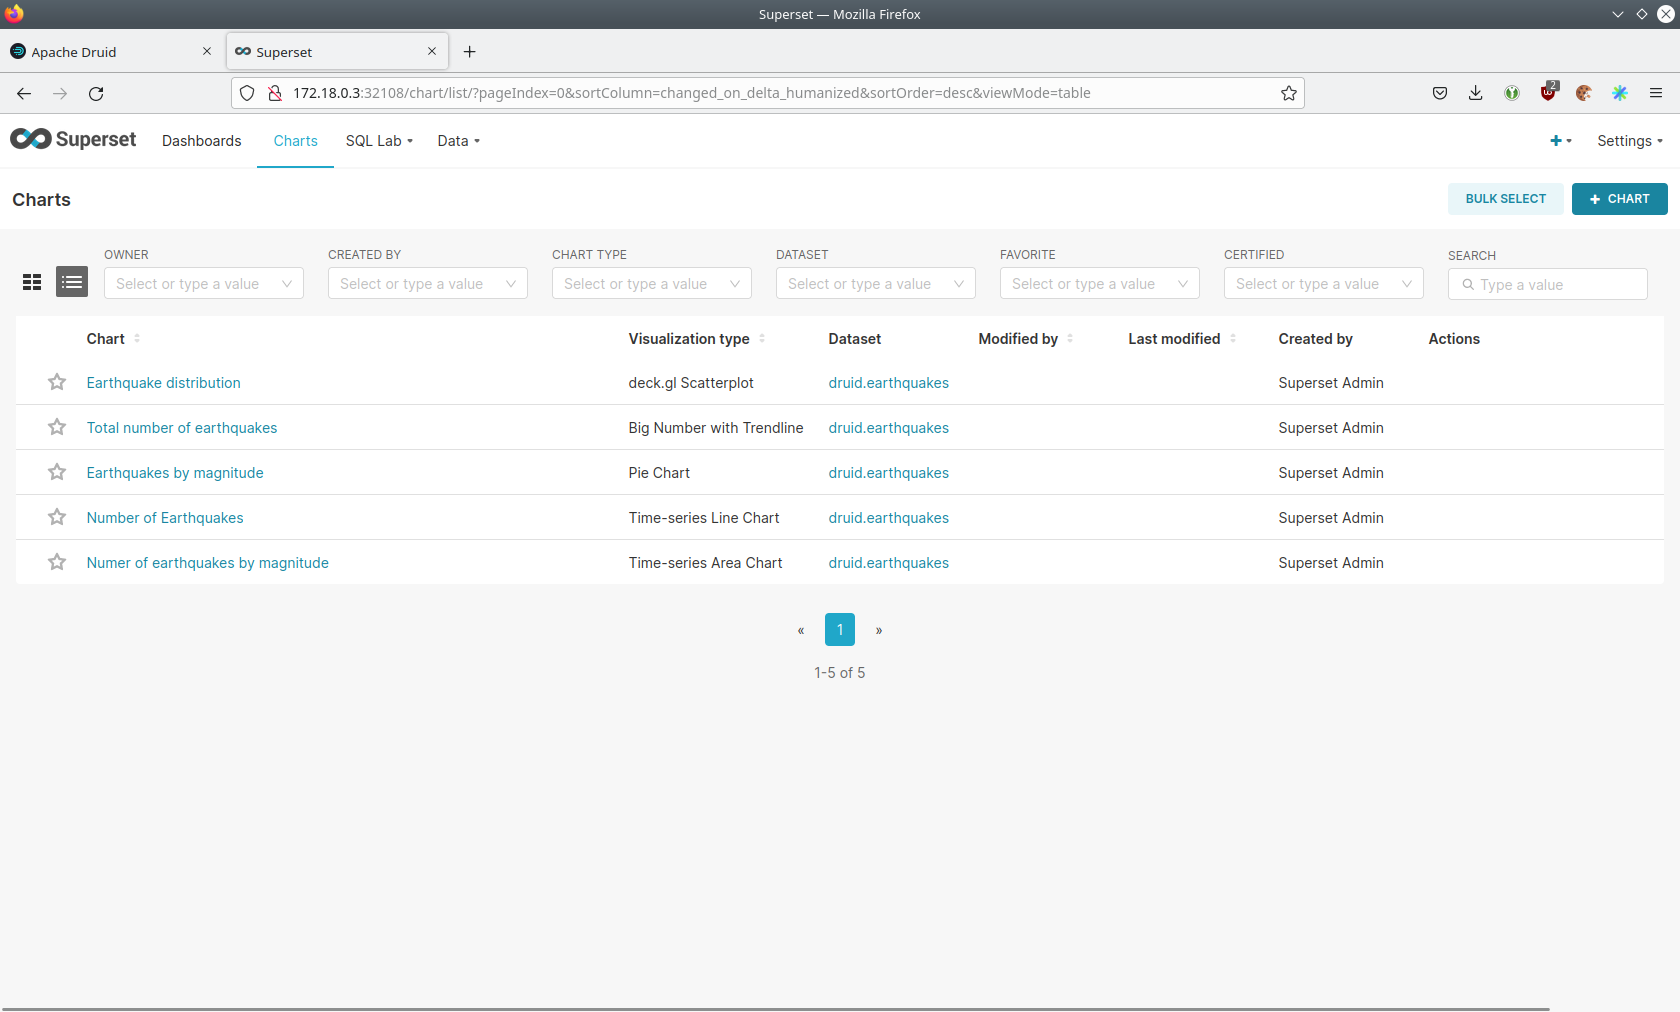
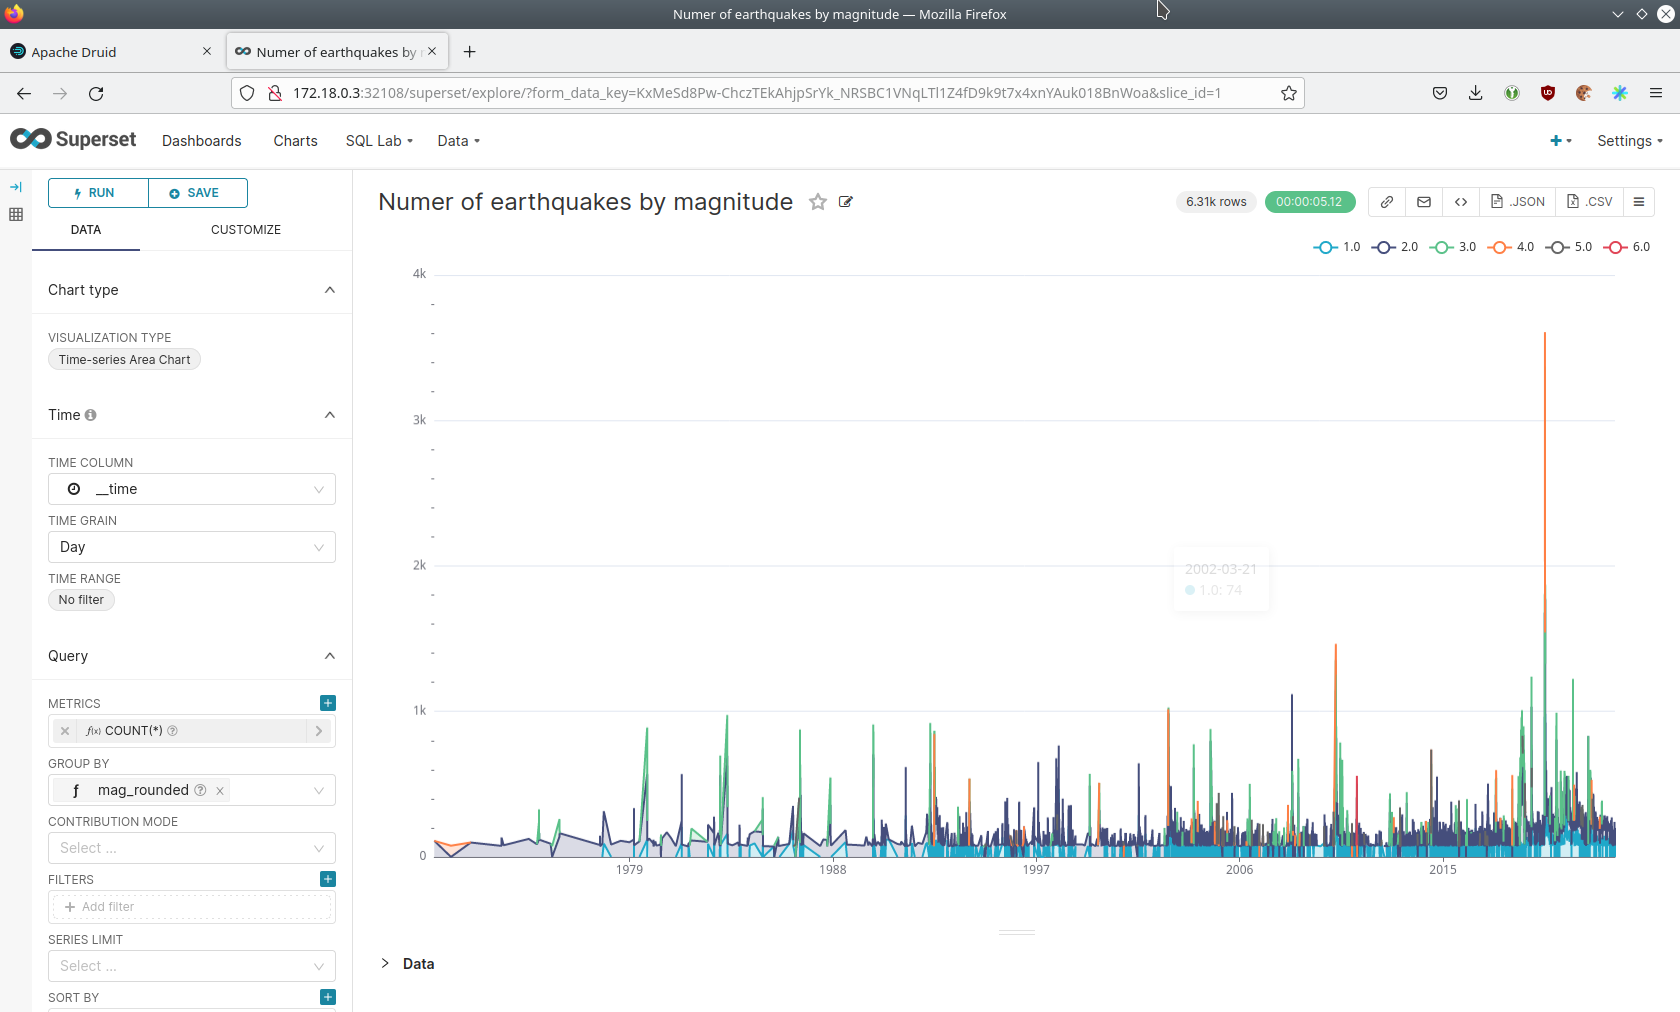
Click on the Chart Number of earthquakes my magnitude.
On the left side you can modify the chart and click on Run to see the effect.
View the earthquake distribution on the world map
To look at the geographical distribution of the earthquakes you have to click on the tab Charts at the top again.
Afterwards click on the chart Earthquake distribution.
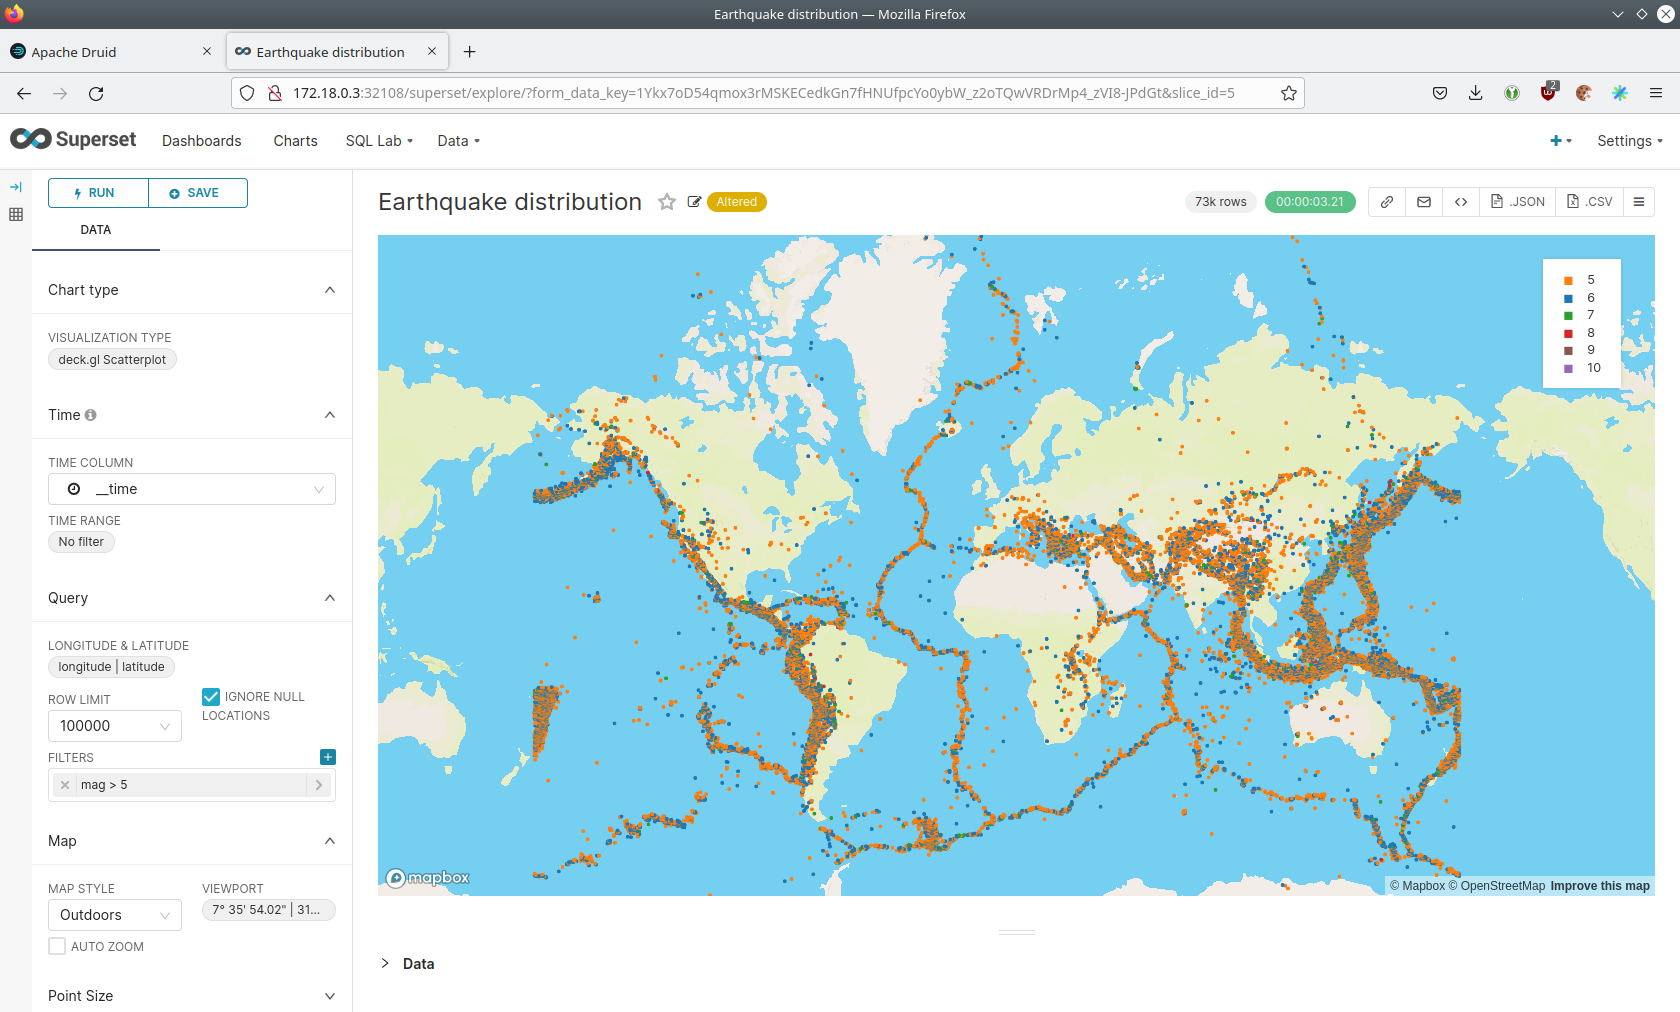
The distribution of the earthquakes matches the continental plate margins. This is the expected distribution from the Wikipedia article on Earthquakes.
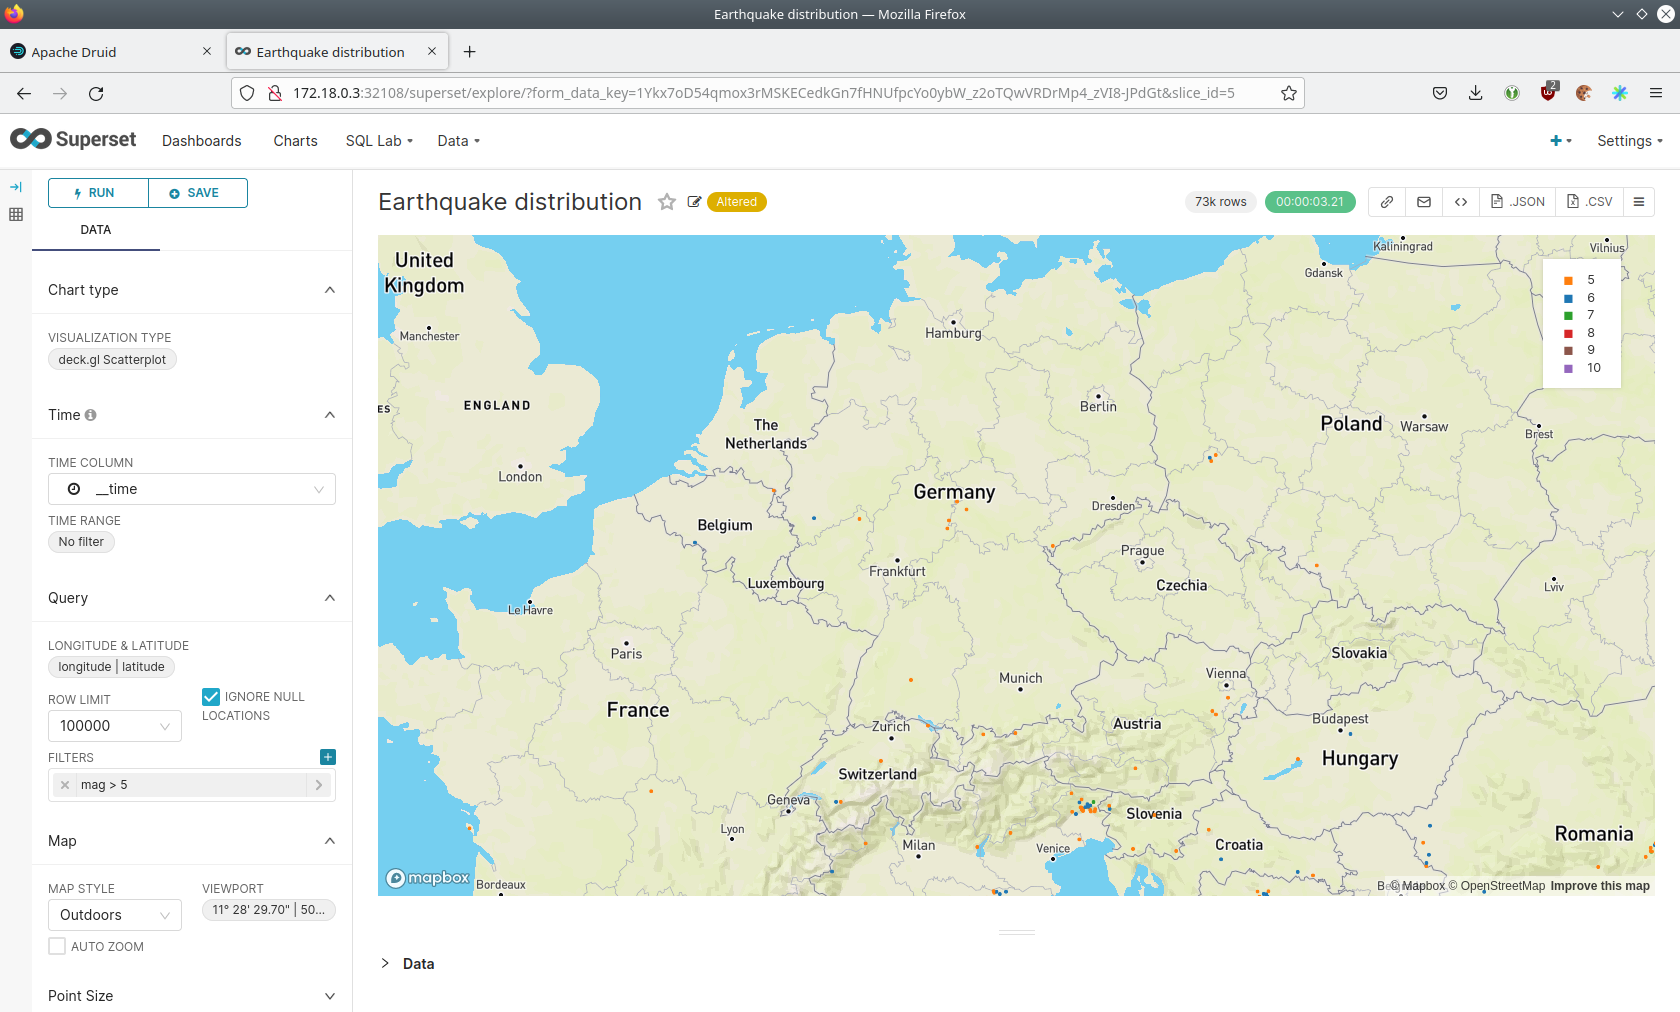
You can move and zoom the map with your mouse to interactively explore the map. You can e.g. have a detailed look at the detected earthquakes in Germany.
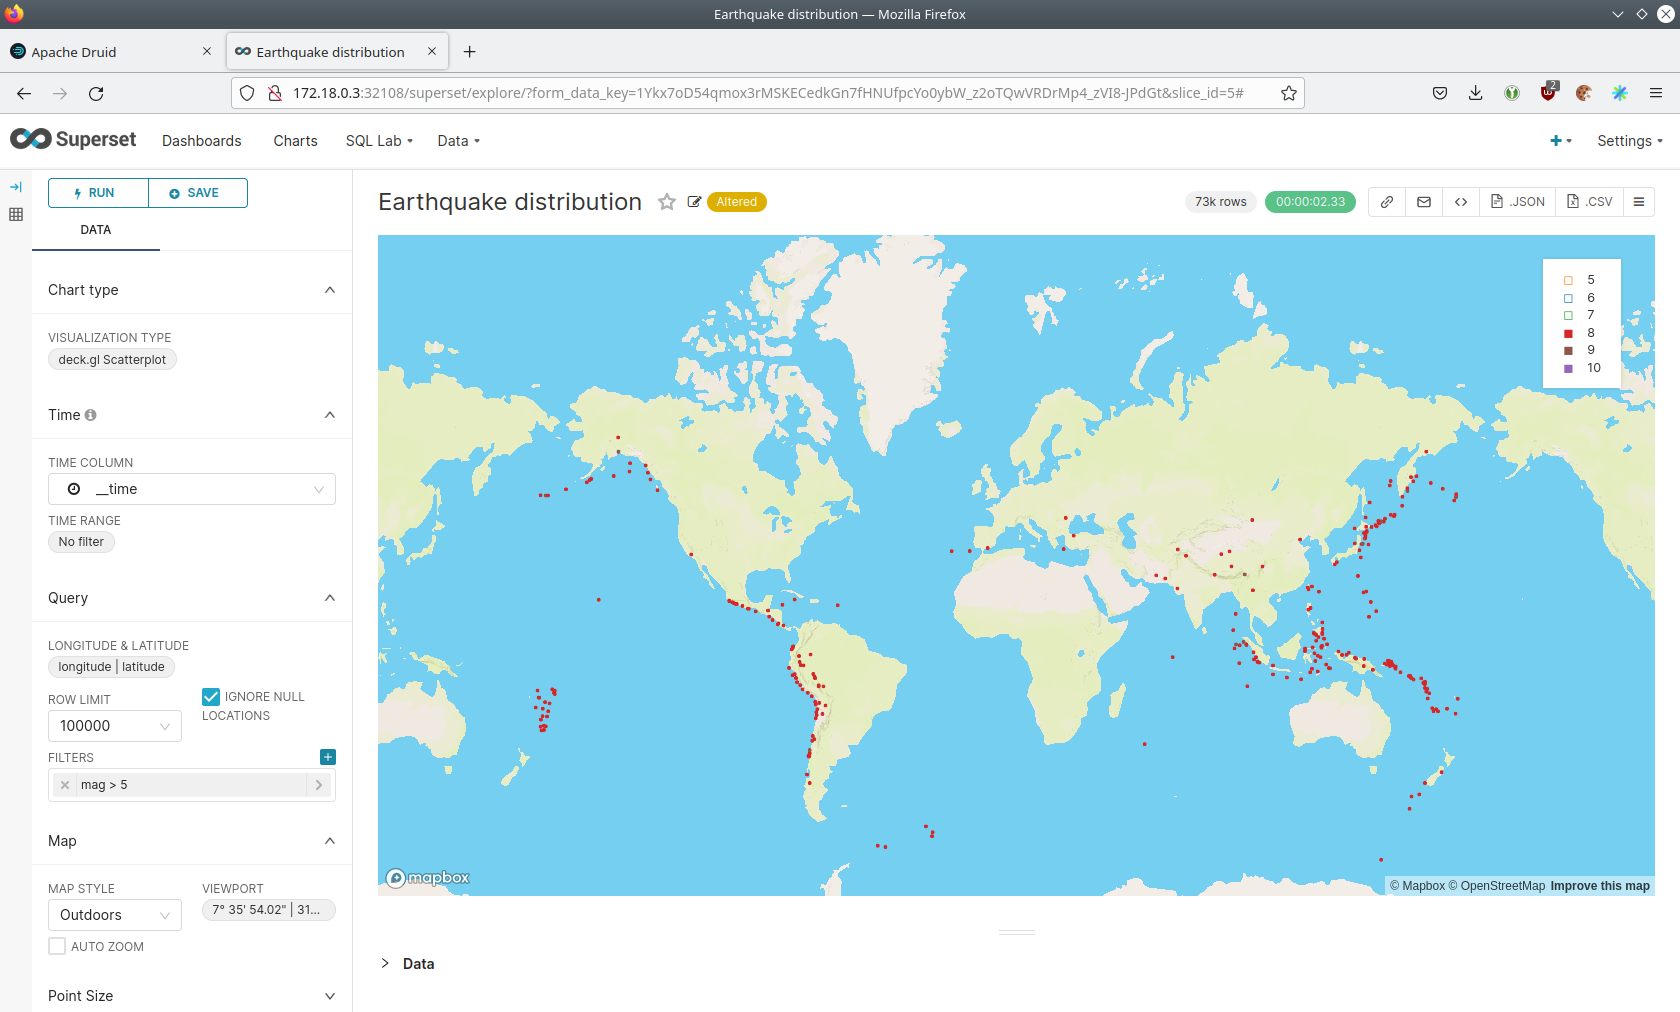
You can also click on the magnitudes in the legend on the top right side to enable/disable printing the earthquakes of that magnitude. By only enabling magnitudes greater or equal to 8 you can plot only the most severe earthquakes.
Execute arbitrary SQL statements
Within Superset you can not only create dashboards but also run arbitrary SQL statements.
On the top click on the tab SQL Lab → SQL Editor.
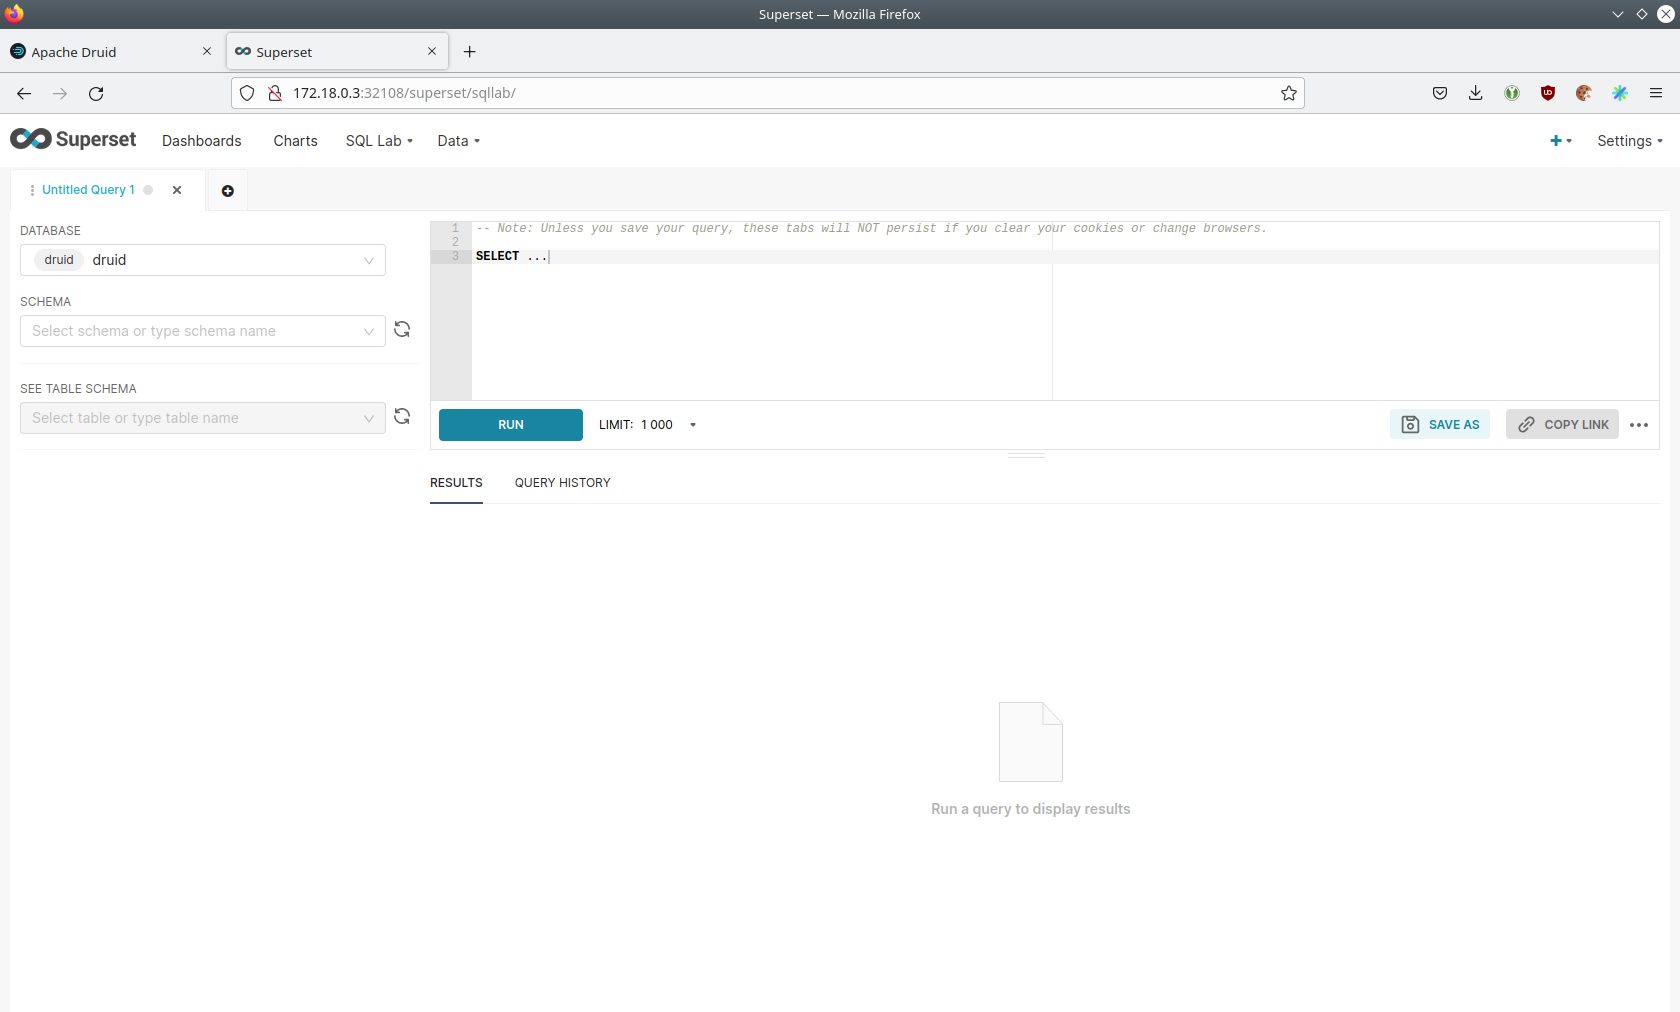
On the left select the database druid, the schema druid and set See table schema to earthquakes.
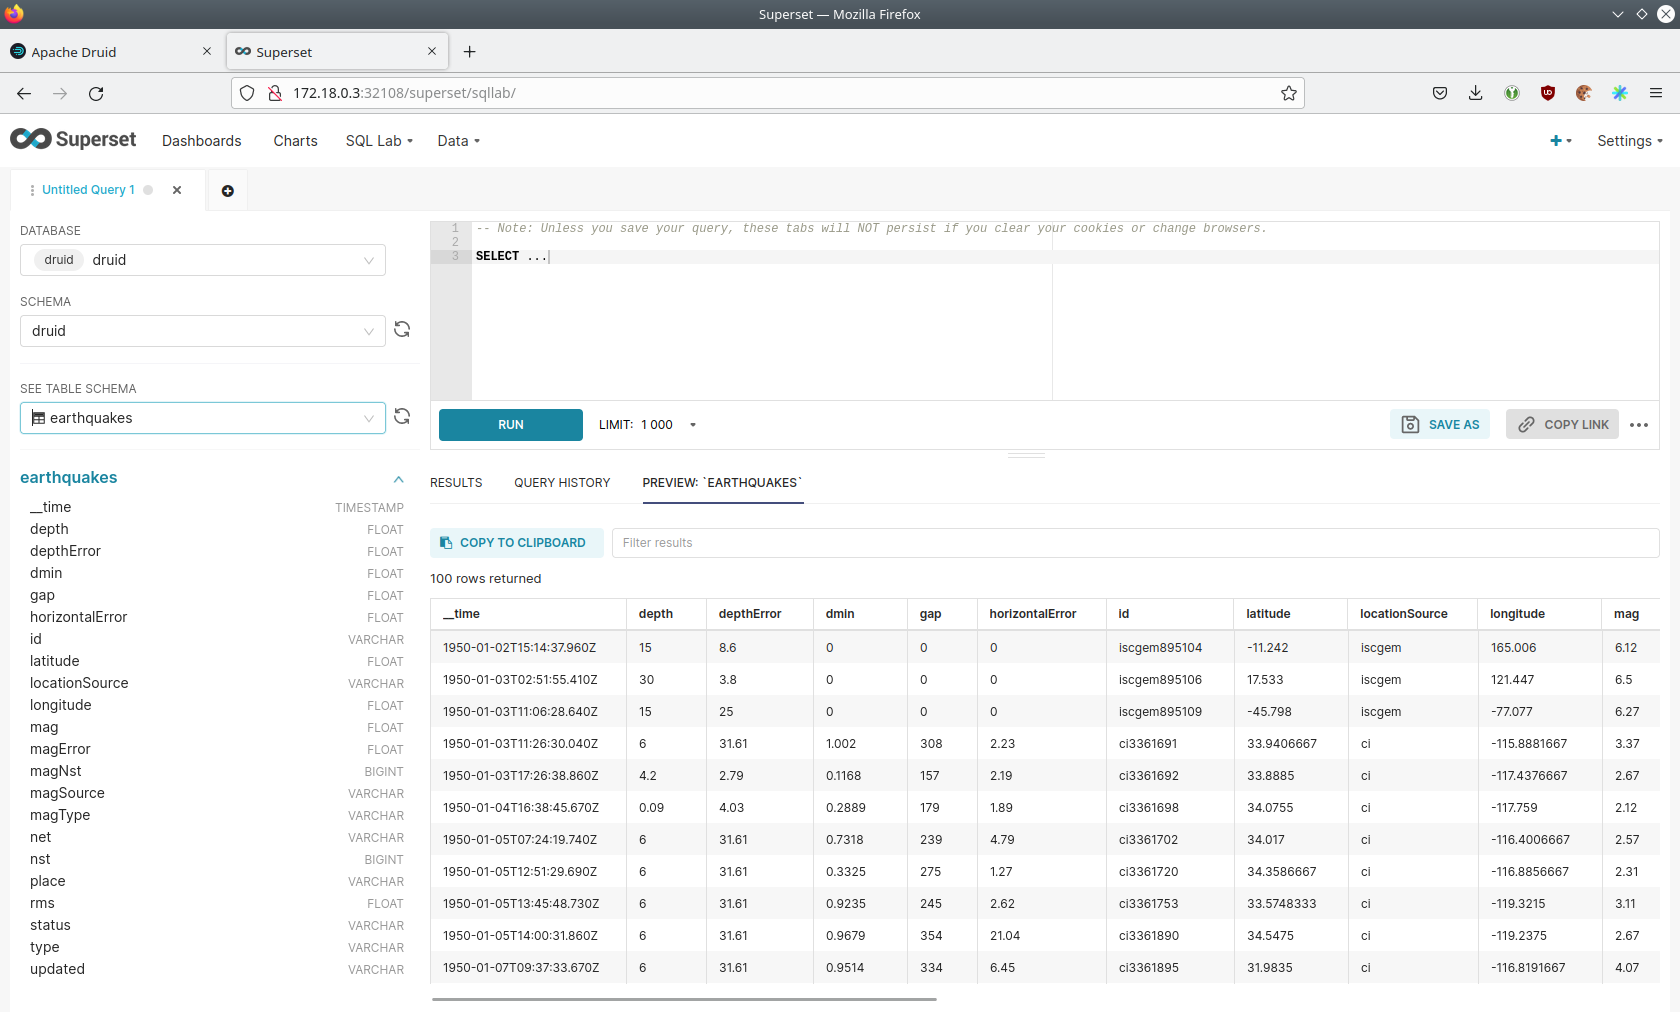
On the right textbox enter the desired SQL statement. If you do not want to make one up, you can use the following:
select
  time_format(__time, 'YYYY') as "year",
  count(*) as earthquakes
from earthquakes
group by 1
order by 1 desc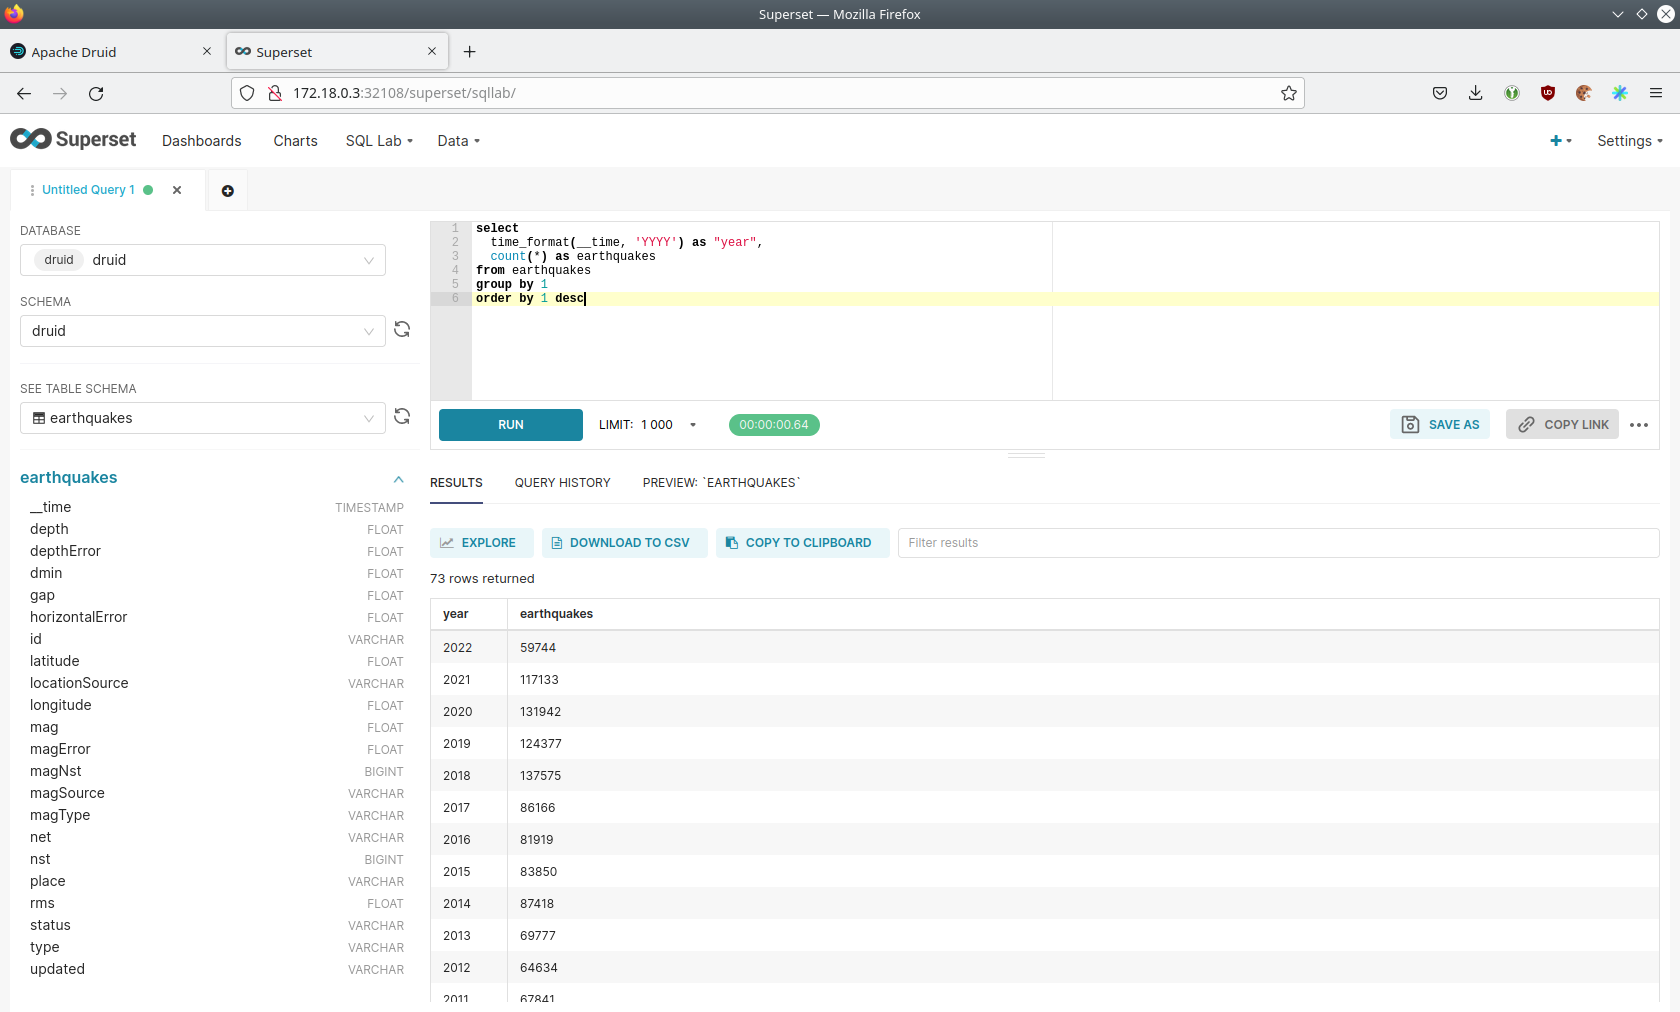
MinIO
The S3 provided by MinIO is used as a persistent deep storage for Druid to store all the data used.
Open the minio endpoint console-http in your browser (http://172.18.0.4:31664 in this case).
Log in with the username admin and password adminadmin.
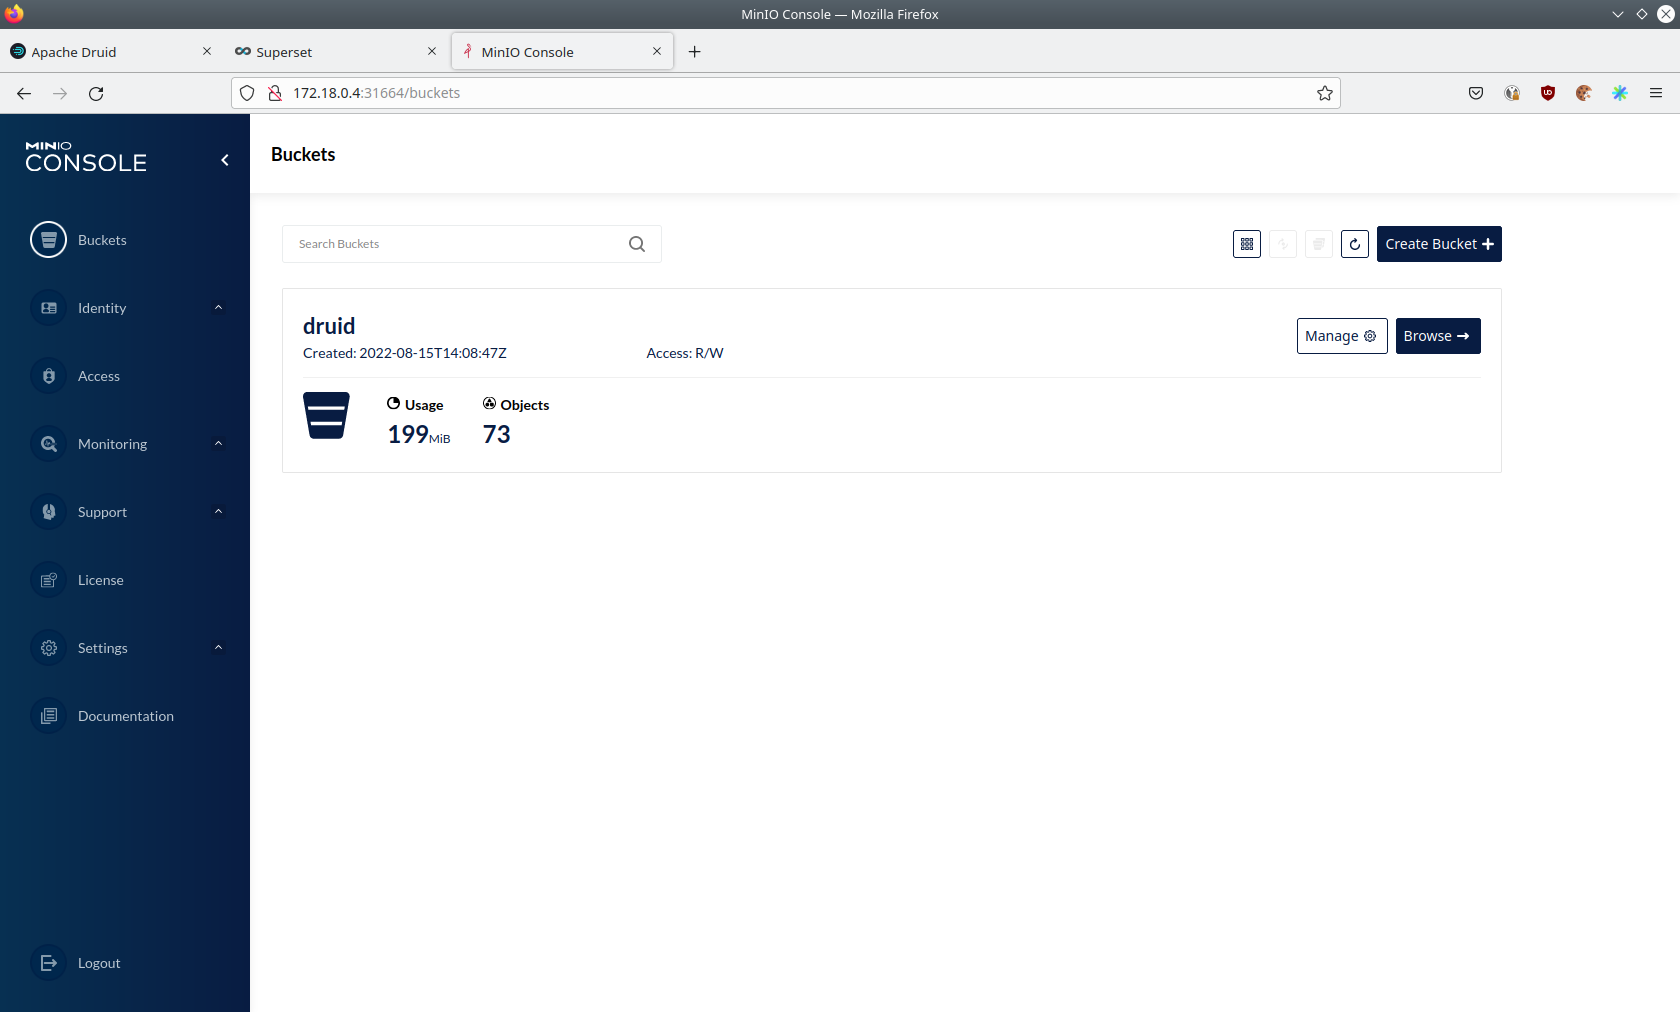
Click on the blue button Browse on the bucket druid and open the folders data → earthquakes.
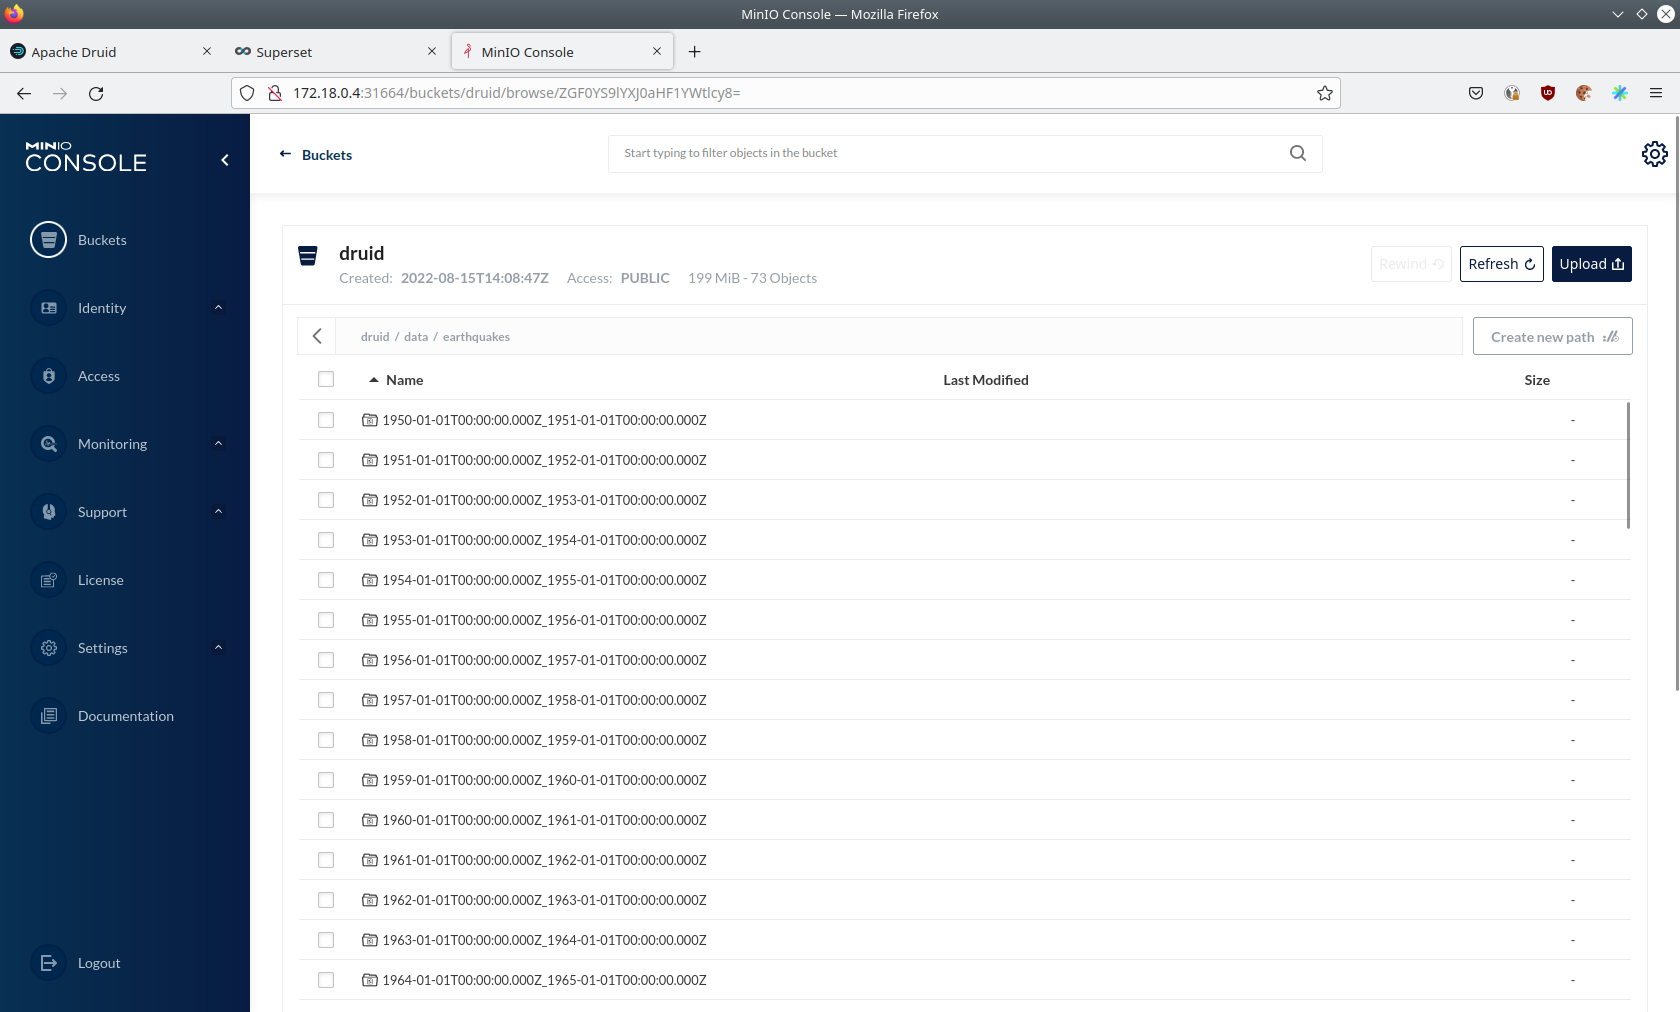
As you can see druid saved 199MB of data within 73 prefixes (folders). One prefix corresponds to on segment which in turn contains all the data of a year. If you don’t see any folders or files, the reason is that Druid has not saved its data from memory to the deep storage yet. After waiting a few minutes, the data should have been flushed to S3 and show up.
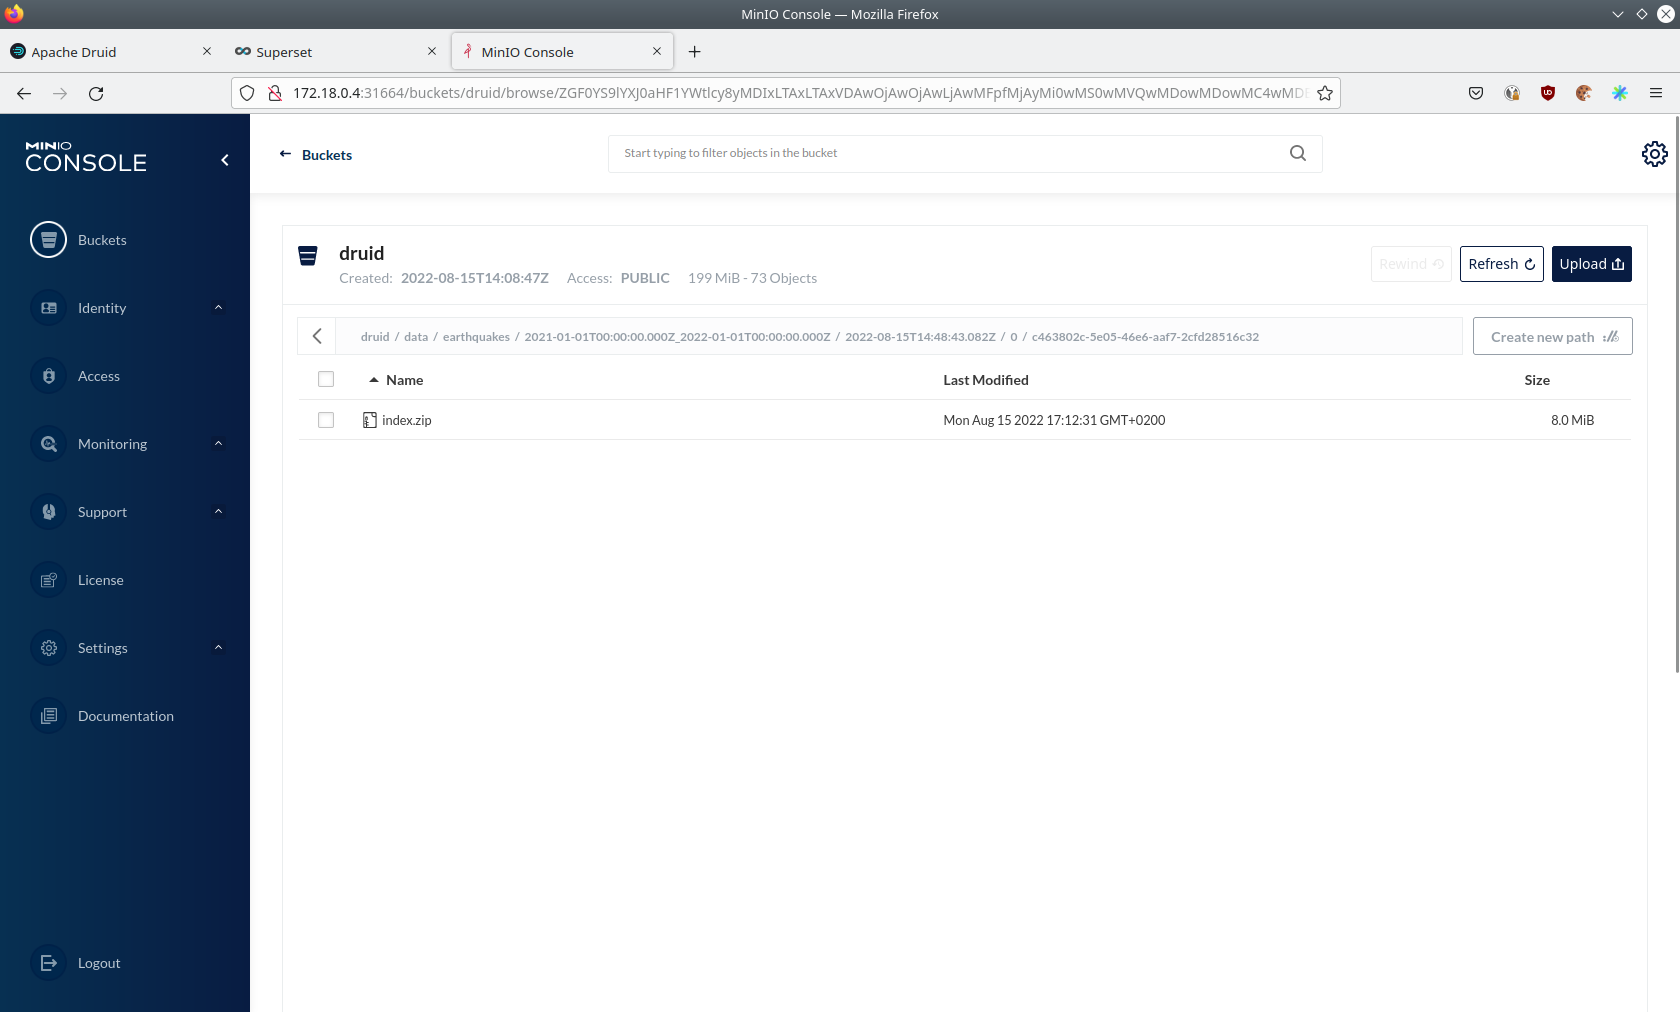
If you open up a prefix for a specific year you can see that Druid has placed a file containing the data of that year there.
Summary
The demo streamed 10,000 earthquake records/s for a total of ~3 million earthquakes into a Kafka steaming pipeline. Druid ingested the data near real-time into its data source and enabled SQL access to it. Superset was used as a web-based frontend to execute SQL statements and build dashboards.
Where to go from here
There are multiple paths to go from here. The following sections can give you some ideas on what to explore next. You can find the description of the earthquake data on the United States Geological Survey website.
Execute arbitrary SQL statements
Within Superset (or the Druid webinterface) you can execute arbitrary SQL statements to explore the earthquake data.
Create additional dashboards
You also have the possibility to create additional charts and bundle them together in a Dashboard. Have a look at the Superset documentation on how to do that.
Load additional data
You can use the NiFi web interface to collect arbitrary data and write it to Kafka (it’s recommended to use new Kafka topics for that). As an alternative you can use a Kafka client like kafkacat to create new topics and ingest data. Using the Druid web interface, you can start an ingestion job that consumes the data and stores it in an internal data source. There is a great tutorial from Druid on how to do this. Afterwards the data source is available to be analyzed within Druid and Superset the same way the earthquake data is.