nifi-kafka-druid-water-level-data
|
This guide assumes that you already have the demo |
This demo will
-
Install the required Stackable operators
-
Spin up the following data products
-
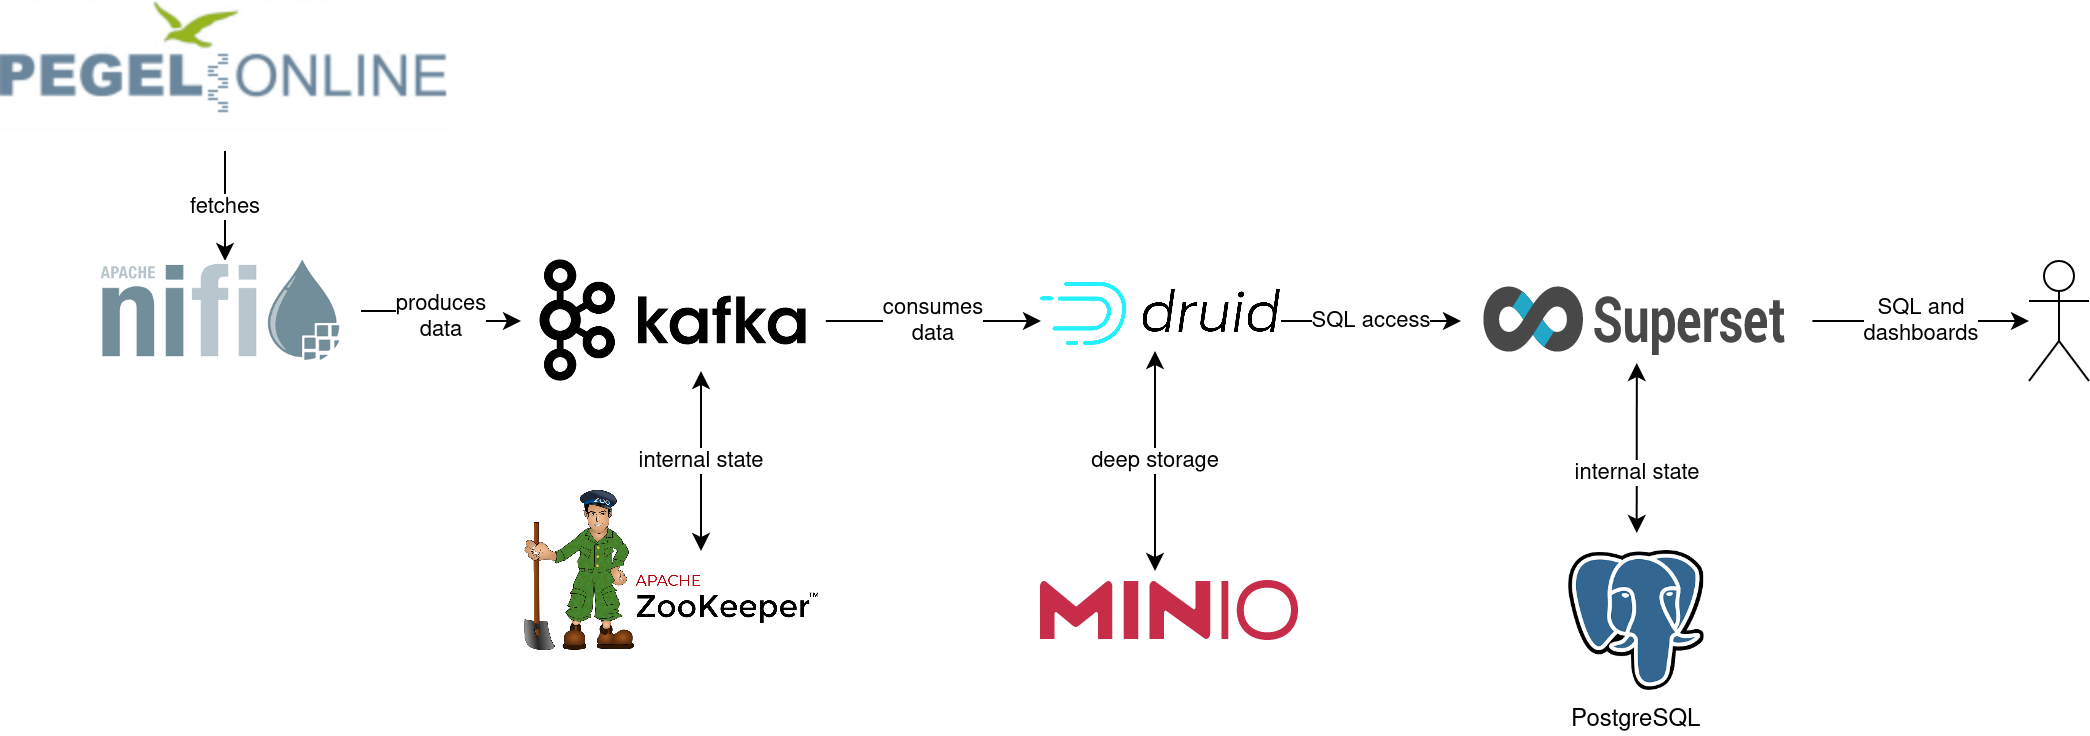
Superset: A modern data exploration and visualization platform. This demo utilizes Superset to retrieve data from Druid via SQL queries and build dashboards on top of that data
-
Kafka: A distributed event streaming platform for high-performance data pipelines, streaming analytics and data integration. This demos uses it as an event streaming platform to stream the data in near real-time
-
NiFi: An easy-to-use, powerful system to process and distribute data. This demos uses it to fetch water-level-data from the internet and ingest it into Kafka
-
Druid: A real-time database to power modern analytics applications. This demo uses it to ingest the near real-time data from Kafka, store it and enable to access the data via SQL
-
MinIO: A S3 compatible object store. This demo uses it as persistent storage for Druid to store all the data used
-
-
Ingest water level data from the PEGELONLINE webservice into Kafka. The data contains measured water levels of different measuring stations all around Germany. If the webservice is not available this demo will not work, as it needs the webservice to ingest the data.
-
First of, historical data of the last 31 days will be fetched and ingested
-
Afterwards the demo will fetch the current measurement of every station approximately every two minutes and ingest it near-realtime into Kafka
-
-
Start a Druid ingestion job that ingests the data into the Druid instance
-
Create Superset dashboards for visualization of the data
The whole data pipeline will have a very low latency from putting a record into Kafka to it showing up in the dashboard charts.
You can see the deployed products as well as their relationship in the following diagram:
List deployed Stackable services
To list the installed Stackable services run the following command:
$ stackablectl services list --all-namespaces
 PRODUCT    NAME         NAMESPACE  ENDPOINTS                                   EXTRA INFOS

 druid      druid        default    broker-http        http://172.18.0.5:30837
                                    coordinator-http   http://172.18.0.5:30476
                                    historical-http    http://172.18.0.5:30592
                                    middlemanager-http http://172.18.0.4:32246
                                    router-http        http://172.18.0.4:30899

 kafka      kafka        default    kafka              172.18.0.3:32536

 nifi       nifi         default    https              https://172.18.0.3:32440  Admin user: admin, password: adminadmin

 superset   superset     default    external-superset  http://172.18.0.4:32251   Admin user: admin, password: adminadmin

 zookeeper  zookeeper    default    zk                 172.18.0.3:31615

 minio      minio-druid  default    http               http://172.18.0.5:30016   Third party service
console-http http://172.18.0.5:32595 Admin user: admin, password: adminadmin|
When a product instance has not finished starting yet, the service will have no endpoint. Starting all the product instances might take a considerable amount of time depending on your internet connectivity. In case the product is not ready yet a warning might be shown. |
Inspect data in Kafka
Kafka is used as an event streaming platform to stream the data in near real-time.
All the messages put in and read from Kafka are structured in dedicated queues called topics.
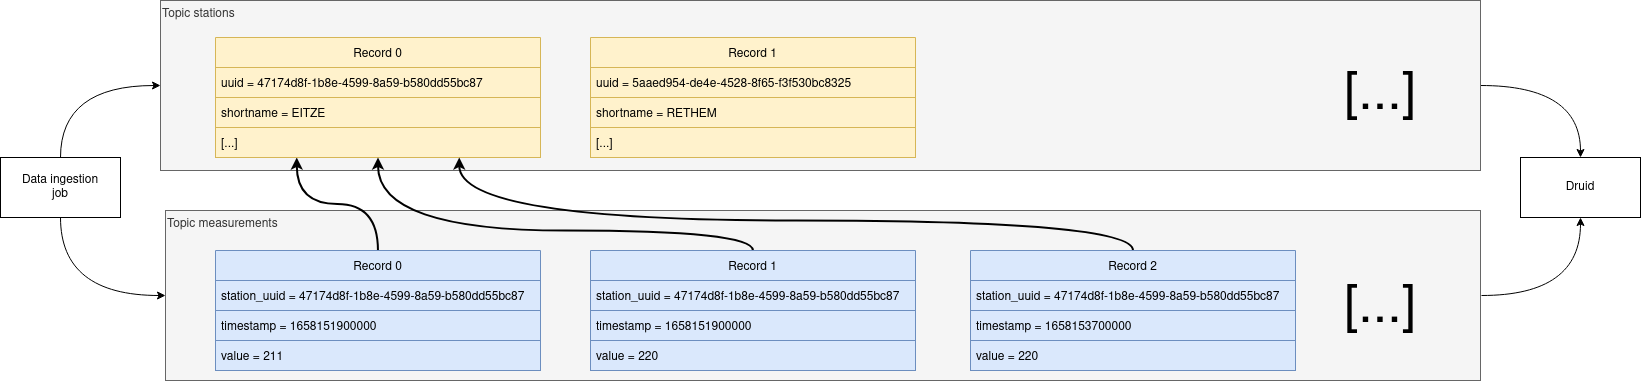
The test data is split across two topic called stations and measurements.
The topic stations contains a record for every station that can measure the water level.
The topic measurements contains a record for every measurement that has happened.
The records are produced (written) by the data ingestion job and are consumed (read) by Druid afterwards in the same order they where produced.
As Kafka itself has no webinterface you have to use a Kafka client like kafkacat.
In order to connect to Kafka, use the kafka endpoint from the kafka service in your stackablectl services list command output (172.18.0.3:32536 in this case).
List available topics
If you have kafkacat installed, you can see the available brokers and topics with the following command.
You need to replace the -b parameter to match your Kafka endpoint.
$ kafkacat -b 172.18.0.3:32536 -L
Metadata for all topics (from broker -1: 172.18.0.3:32536/bootstrap):
 1 brokers:
  broker 1001 at 172.18.0.3:31631 (controller)
 2 topics:
  topic "stations" with 1 partitions:
    partition 0, leader 1001, replicas: 1001, isrs: 1001
  topic "measurements" with 1 partitions:
    partition 0, leader 1001, replicas: 1001, isrs: 1001
You can see that Kafka consists of one broker and the topics stations and measurements have been created.
Show sample records
To see some records that have been send to Kafka run the following commands.
You can change the number of records to print via the -c parameter.
The | jq part can be emitted if you don’t have jq installed (it’s used to pretty-print the json here).
kafkacat -b 172.18.0.3:32536 -C -t stations -c 2 | jq
{
  "uuid": "47174d8f-1b8e-4599-8a59-b580dd55bc87",
  "number": 48900237,
  "shortname": "EITZE",
  "longname": "EITZE",
  "km": 9.56,
  "agency": "VERDEN",
  "longitude": 9.2767694354,
  "latitude": 52.9040654474,
  "water": {
    "shortname": "ALLER",
    "longname": "ALLER"
  }
}
{
  "uuid": "5aaed954-de4e-4528-8f65-f3f530bc8325",
  "number": 48900204,
  "shortname": "RETHEM",
  "longname": "RETHEM",
  "km": 34.22,
  "agency": "VERDEN",
  "longitude": 9.3828408101,
  "latitude": 52.7890975921,
  "water": {
    "shortname": "ALLER",
    "longname": "ALLER"
  }
}
kafkacat -b 172.18.0.3:32536 -C -t measurements -c 3 | jq
{
"timestamp": 1658151900000,
"value": 221,
"station_uuid": "47174d8f-1b8e-4599-8a59-b580dd55bc87"
}
{
"timestamp": 1658152800000,
"value": 220,
"station_uuid": "47174d8f-1b8e-4599-8a59-b580dd55bc87"
}
{
"timestamp": 1658153700000,
"value": 220,
"station_uuid": "47174d8f-1b8e-4599-8a59-b580dd55bc87"
}The records of the two topics only contain the needed data.
The measurement records contain a station_uuid to refer to the measuring station.
The relationship is illustrated below.
The reason for splitting the data up into two different topics is the improved performance. One simpler solution would be to use a single topic and produce records that look like the following:
{
  "uuid": "47174d8f-1b8e-4599-8a59-b580dd55bc87",
  "number": 48900237,
  "shortname": "EITZE",
  "longname": "EITZE",
  "km": 9.56,
  "agency": "VERDEN",
  "longitude": 9.2767694354,
  "latitude": 52.9040654474,
  "water": {
    "shortname": "ALLER",
    "longname": "ALLER"
  },
  "timestamp": 1658151900000,
  "value": 221
}
----
Notice the two last attributes that differ from the previously shown stations records.
The obvious downside of this is, that every measurement (there are multiple millions of it) has to contain all the data known about the station that it was measured at.
This leads to transmitting and storing duplicated information of e.g. the longitude of a station many times, resulting in increased network traffic and storage usage.
The solution is to only transmit the known/needed data of either a station or a measurement.
This process is called data normalization.
The downside here is, that when analyzing the data you need to combine the records from multiple tables in Druid (stations and measurements).
If you are interested on how many records have been produced to the Kafka topic so far, use the following command.
It will print the last record produced to the topic, which will be formatted with the pattern specified in the -f parameter.
The given pattern will print some metadata of the record.
$ kafkacat -b 172.18.0.3:32536 -C -t stations -o -1 -c 1 \
    -f 'Topic %t / Partition %p / Offset: %o / Timestamp: %T\n'
Topic stations / Partition 0 / Offset: 688 / Timestamp: 1660829626969
688 stations have been fetched and put into Kafka.
This demo does not live-stream new stations into the topic, instead it is a one-time bulk ingestion job.
New stations should be pretty rare.
Druid ingests the topic near-realtime regardless.
So if you would produce new stations records they will shop up in Druid and are available for your analysis.
$ kafkacat -b 172.18.0.3:32536 -C -t measurements -o -1 -c 1 \
    -f 'Topic %t / Partition %p / Offset: %o / Timestamp: %T\n'
Topic measurements / Partition 0 / Offset: 7586541 / Timestamp: 1660831499070
The output shows that the last measurement record was produced at the timestamp 1660831499070 which translates to Do 18. Aug 16:04:59 CEST 2022 (using the command date -d @1660831499).
You can also see that it was the record number 7586541 send to this topic, so ~7.6 million records have been produced so far.
NiFi
NiFi is used to fetch water-level-data from the internet and ingest it into Kafka near-realtime. This demo includes a workflow ("process group") that fetches the last 30 days of historical measurements and produces the records into Kafka. It also keeps streaming near-realtime updates for every available measuring station.
View testdata-generation job
You can have a look at the ingestion job running in NiFi by opening the given nifi endpoint https from your stackablectl services list command output.
You have to use the endpoint from your command output, in this case it is https://172.18.0.3:32440. Open it with your favorite browser.
If you get a warning regarding the self-signed certificate generated by the Secret Operator (e.g. Warning: Potential Security Risk Ahead), you have to tell your browser to trust the website and continue.
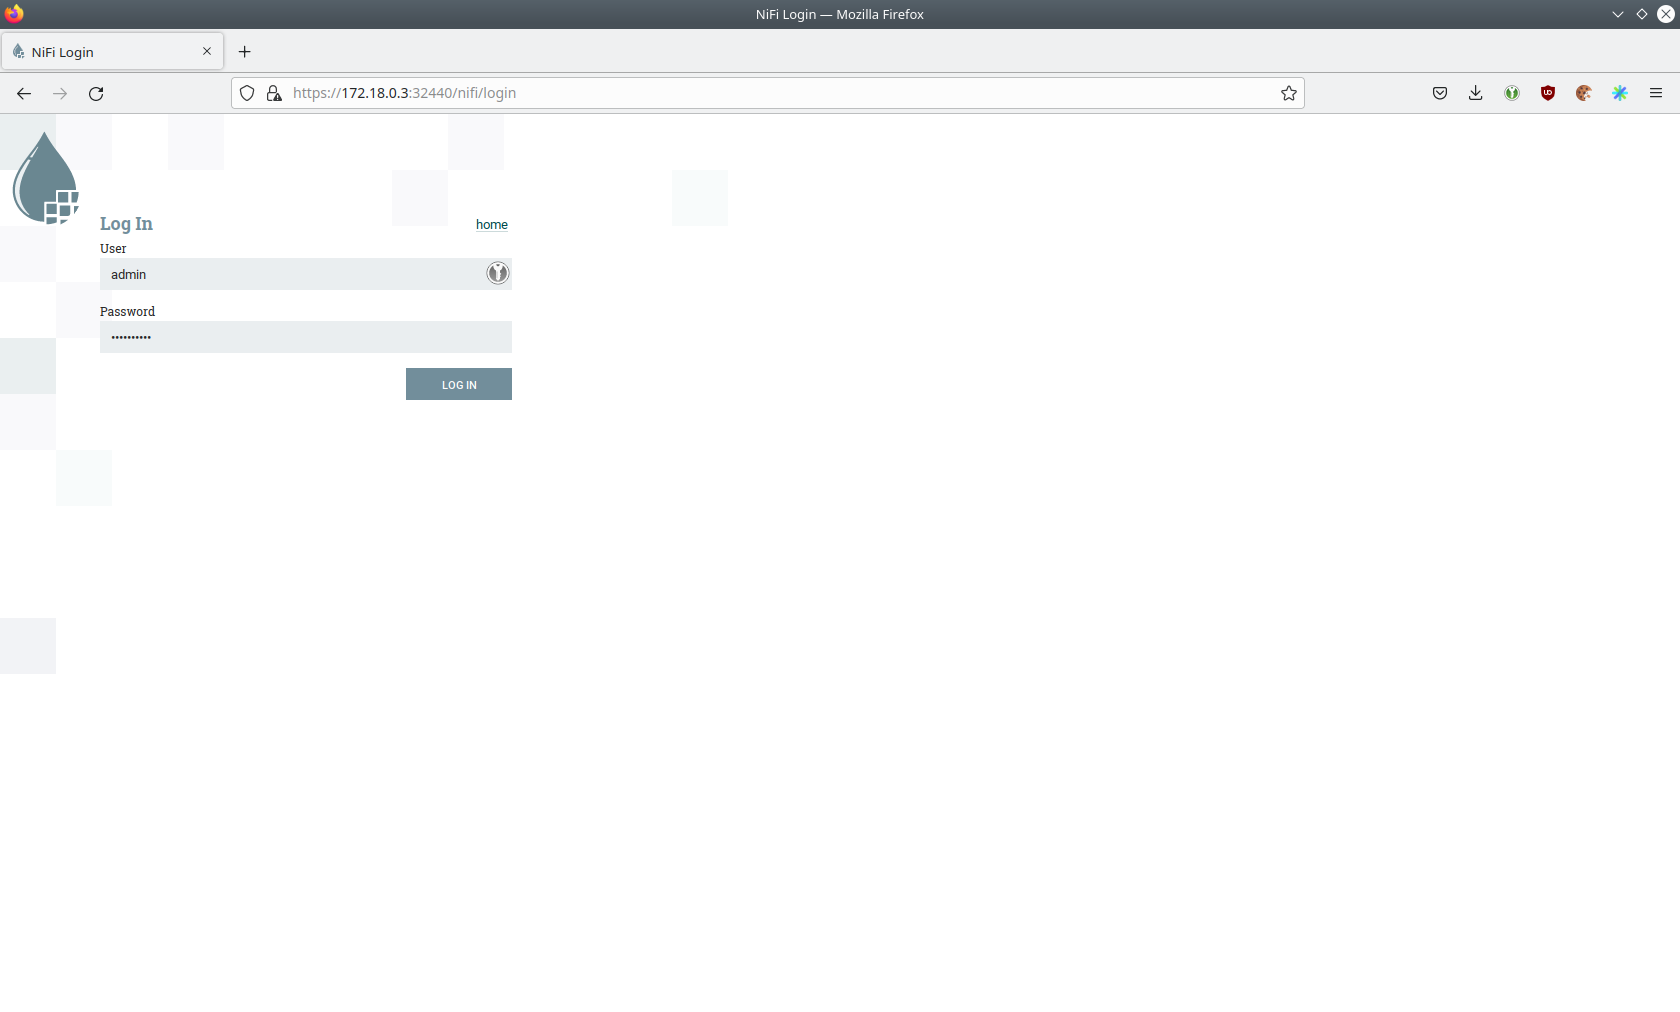
Log in with the username admin and password adminadmin.
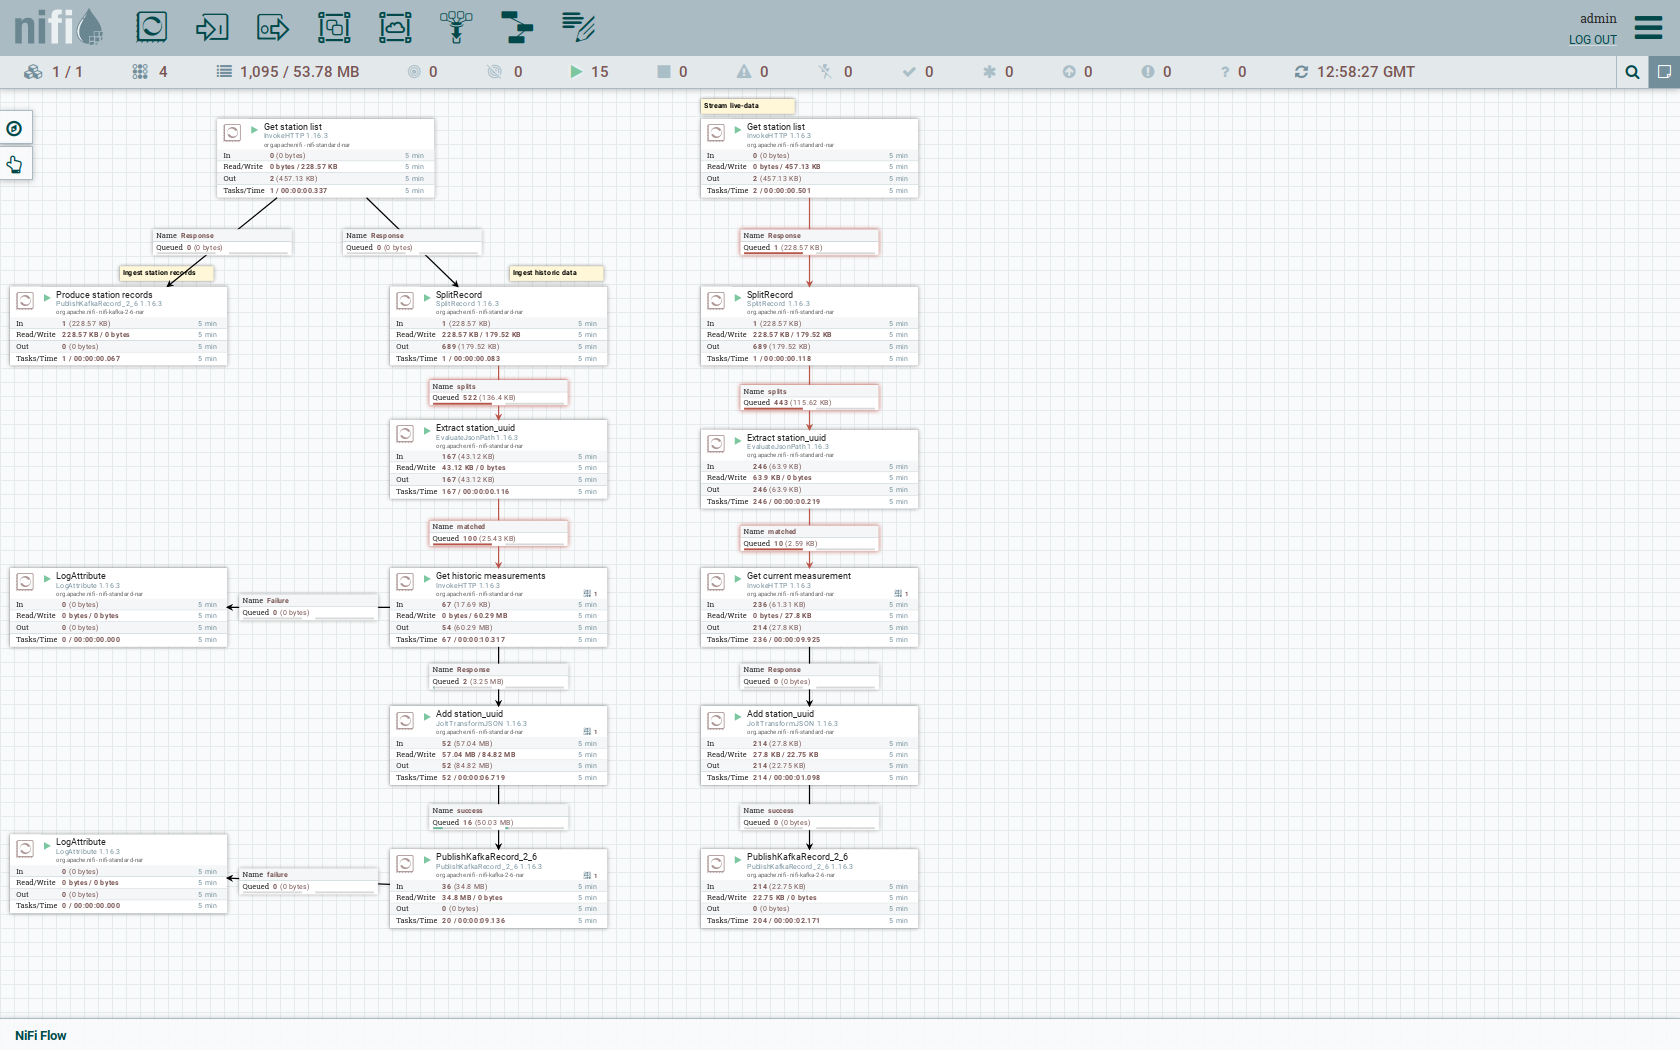
As you can see, the NiFi workflow consists of lot’s of components. It is split into two main components:
-
On the left is the part bulk-loading all the known stations and the historical data of the last 30 days
-
On the right it the other part iterating over all stations and emitting the current measurement in an endless loop
You can zoom in by using your mouse and mouse wheel.
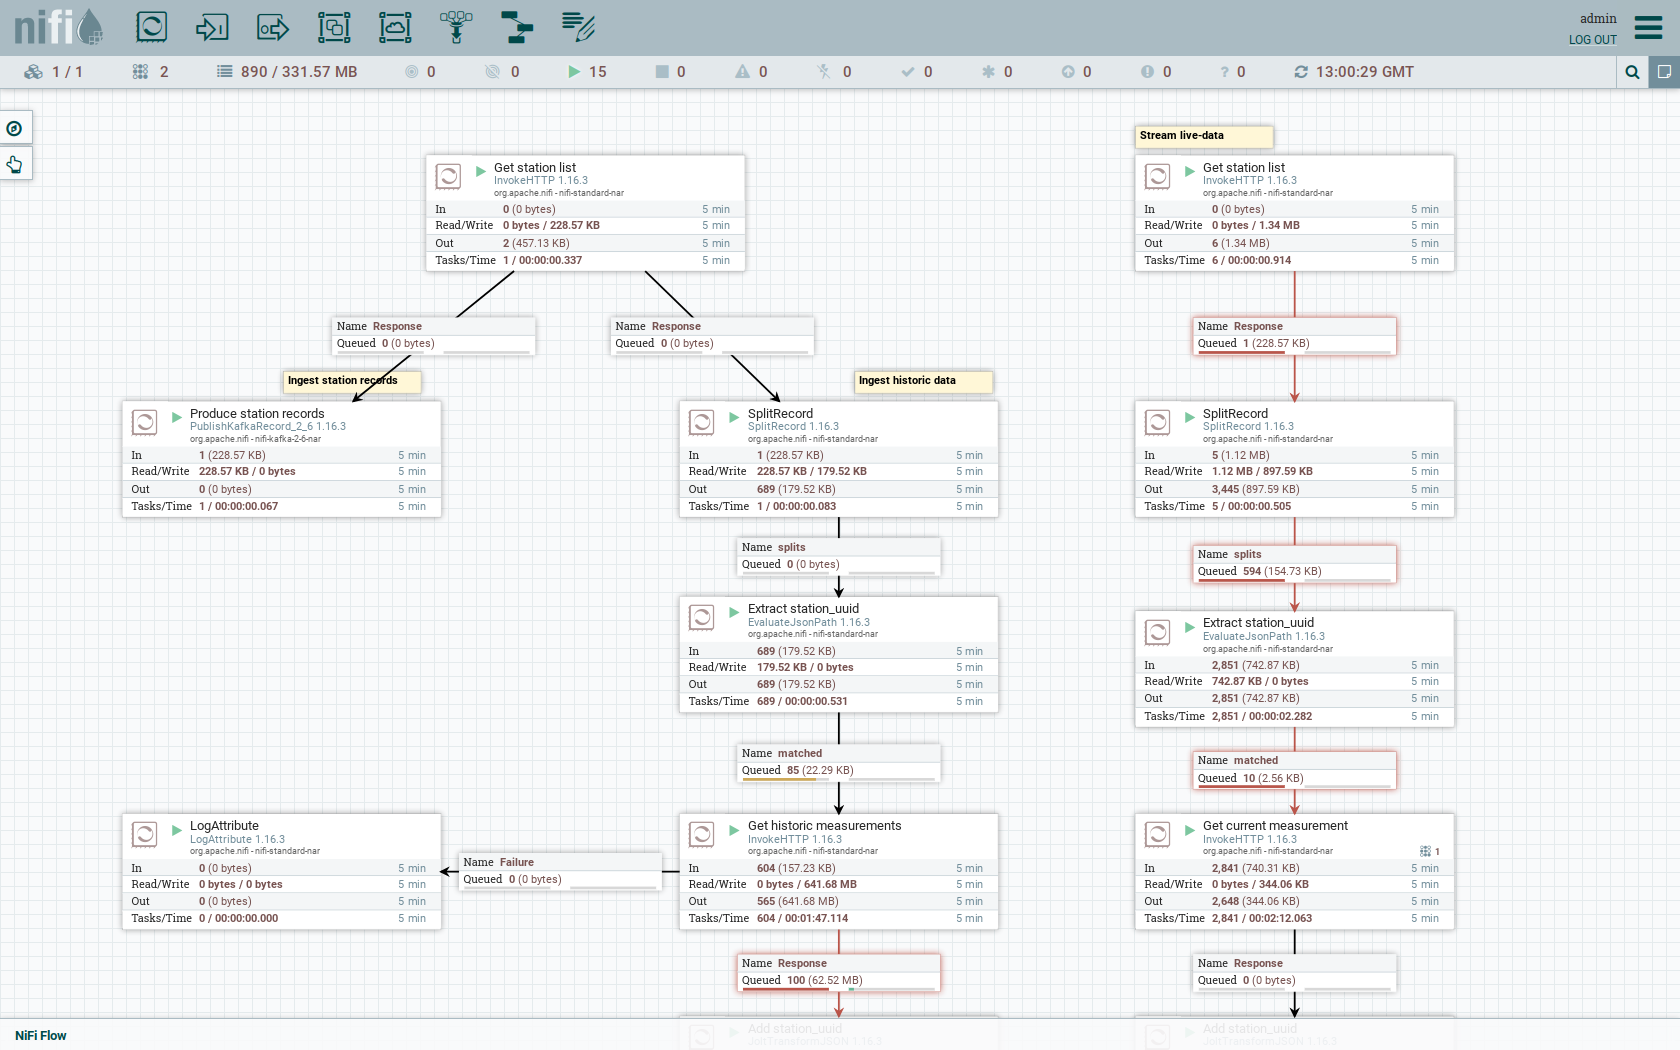
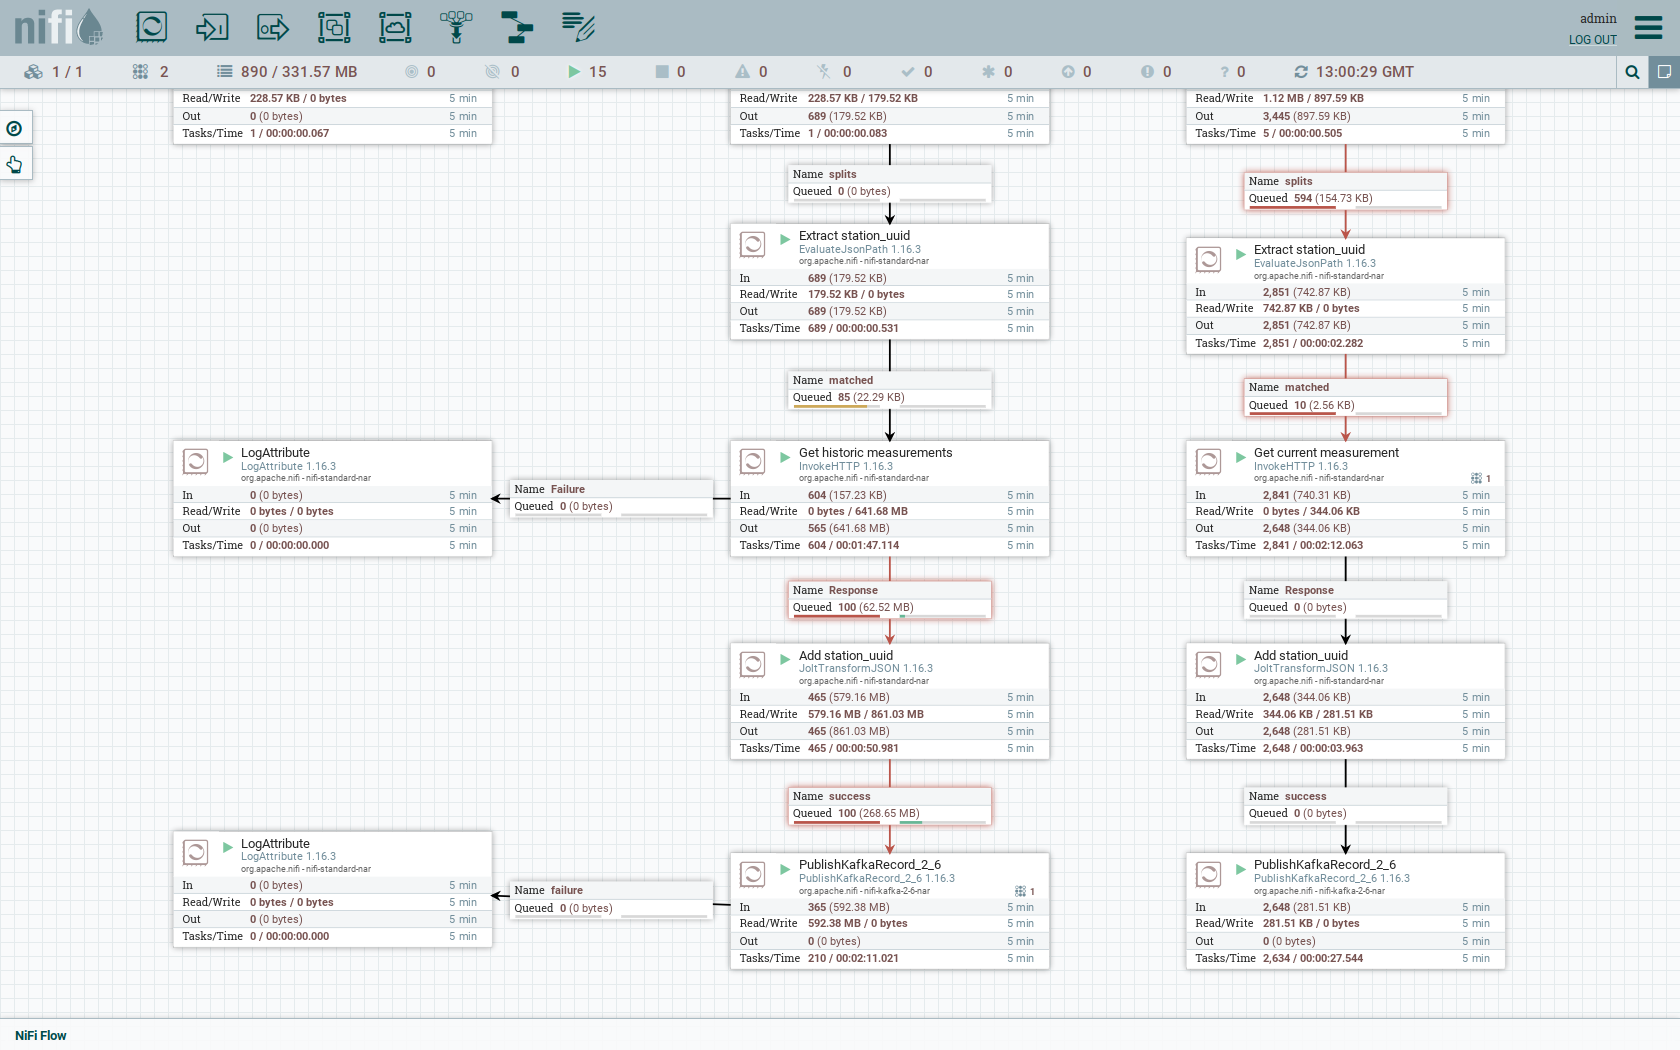
The left workflows works as follows:
-
The
Get station listprocessors fetches the current list of stations as JSON via HTTP from the PEGELONLINE webservice. -
Produce stations recordstakes the list and produces a Kafka record for every station into the topicstations -
SplitRecordssimultaneously takes the single FlowFile (NiFI record) containing all the stations and crates a new FlowFile for every station -
Extract station_uuidtakes every FlowFile representing a station and extract the attributestation_uuidinto the metadata of the FlowFile -
Get historic measurementscalls the PEGELONLINE webservice for every station and fetches the measurements of the last 30 days. All failures are routed to theLogAttributeprocessor to inspect them in case any failure occur. -
Add station_uuidwill add the attributestation_uuidto the JSON list of measurements returned from the PEGELONLINE webservice, which is missing this information. -
PublishKafkaRecord_2_6finally emits every measurement as a Kafka records to the topicmeasurements. All failures are routed to theLogAttributeprocessor to inspect them in case any failures occur.
The right side works similar, but is executed in an endless loop to stream the data in near-realtime.
Double-click on the Get station list processor to show the processor details.
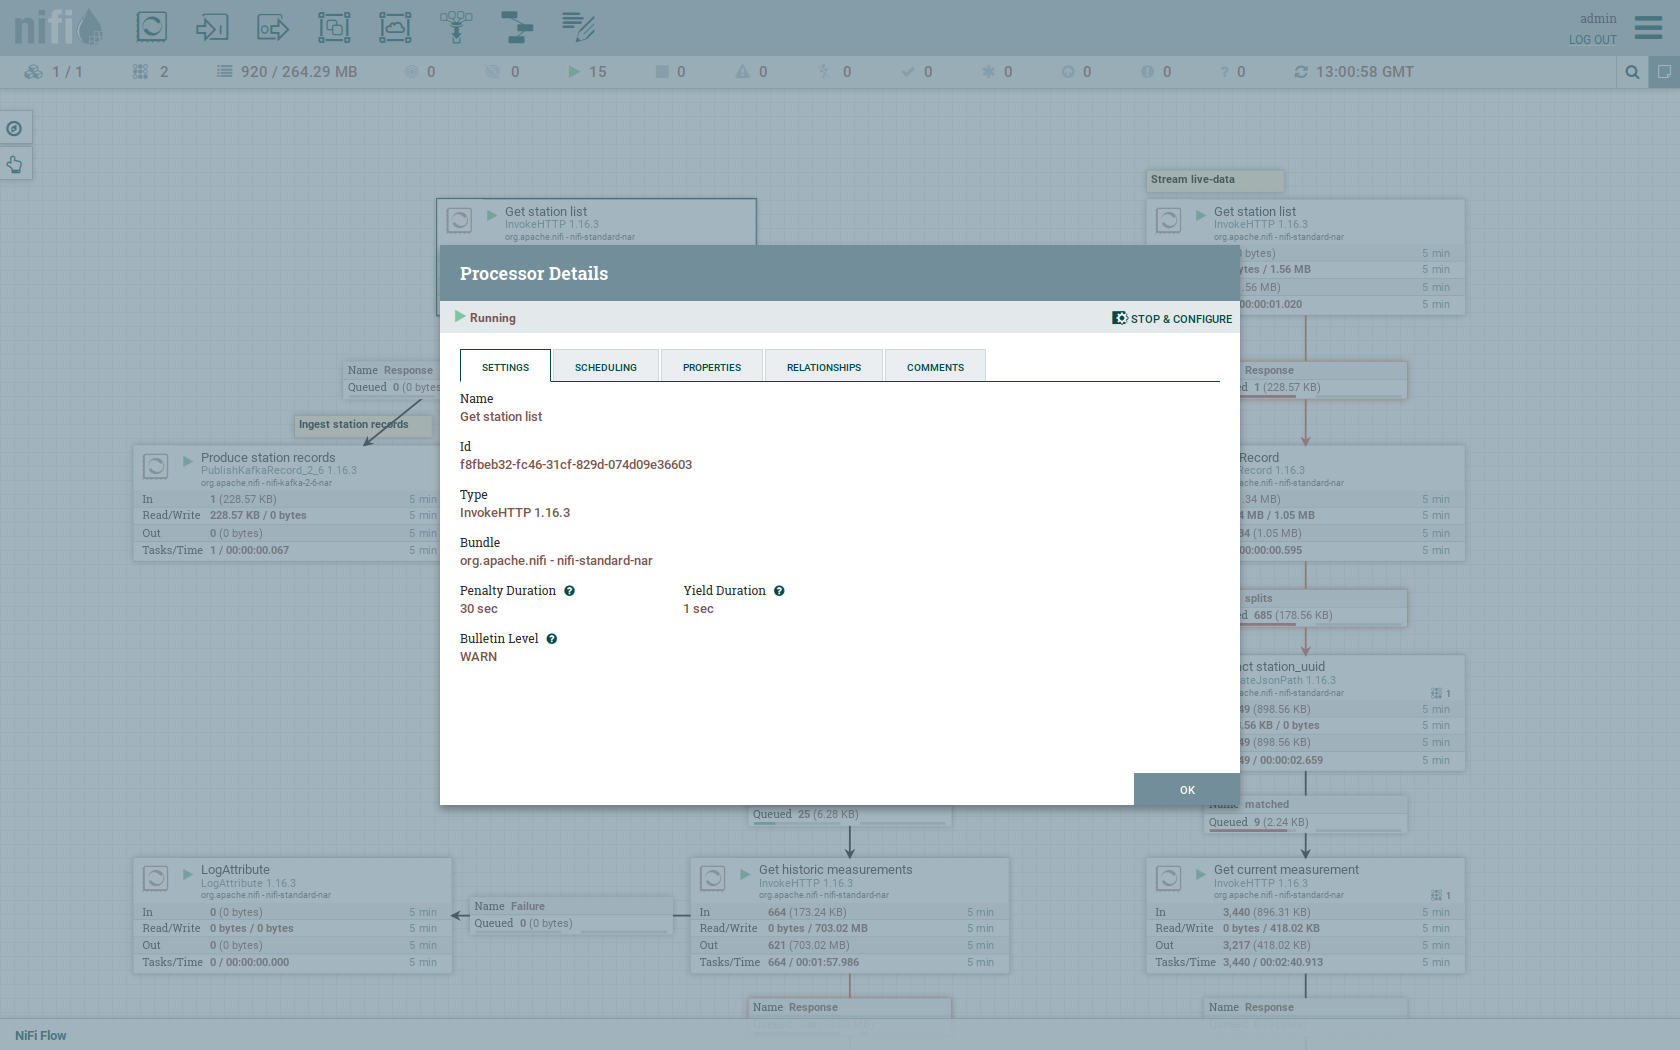
Head over to the tab PROPERTIES.
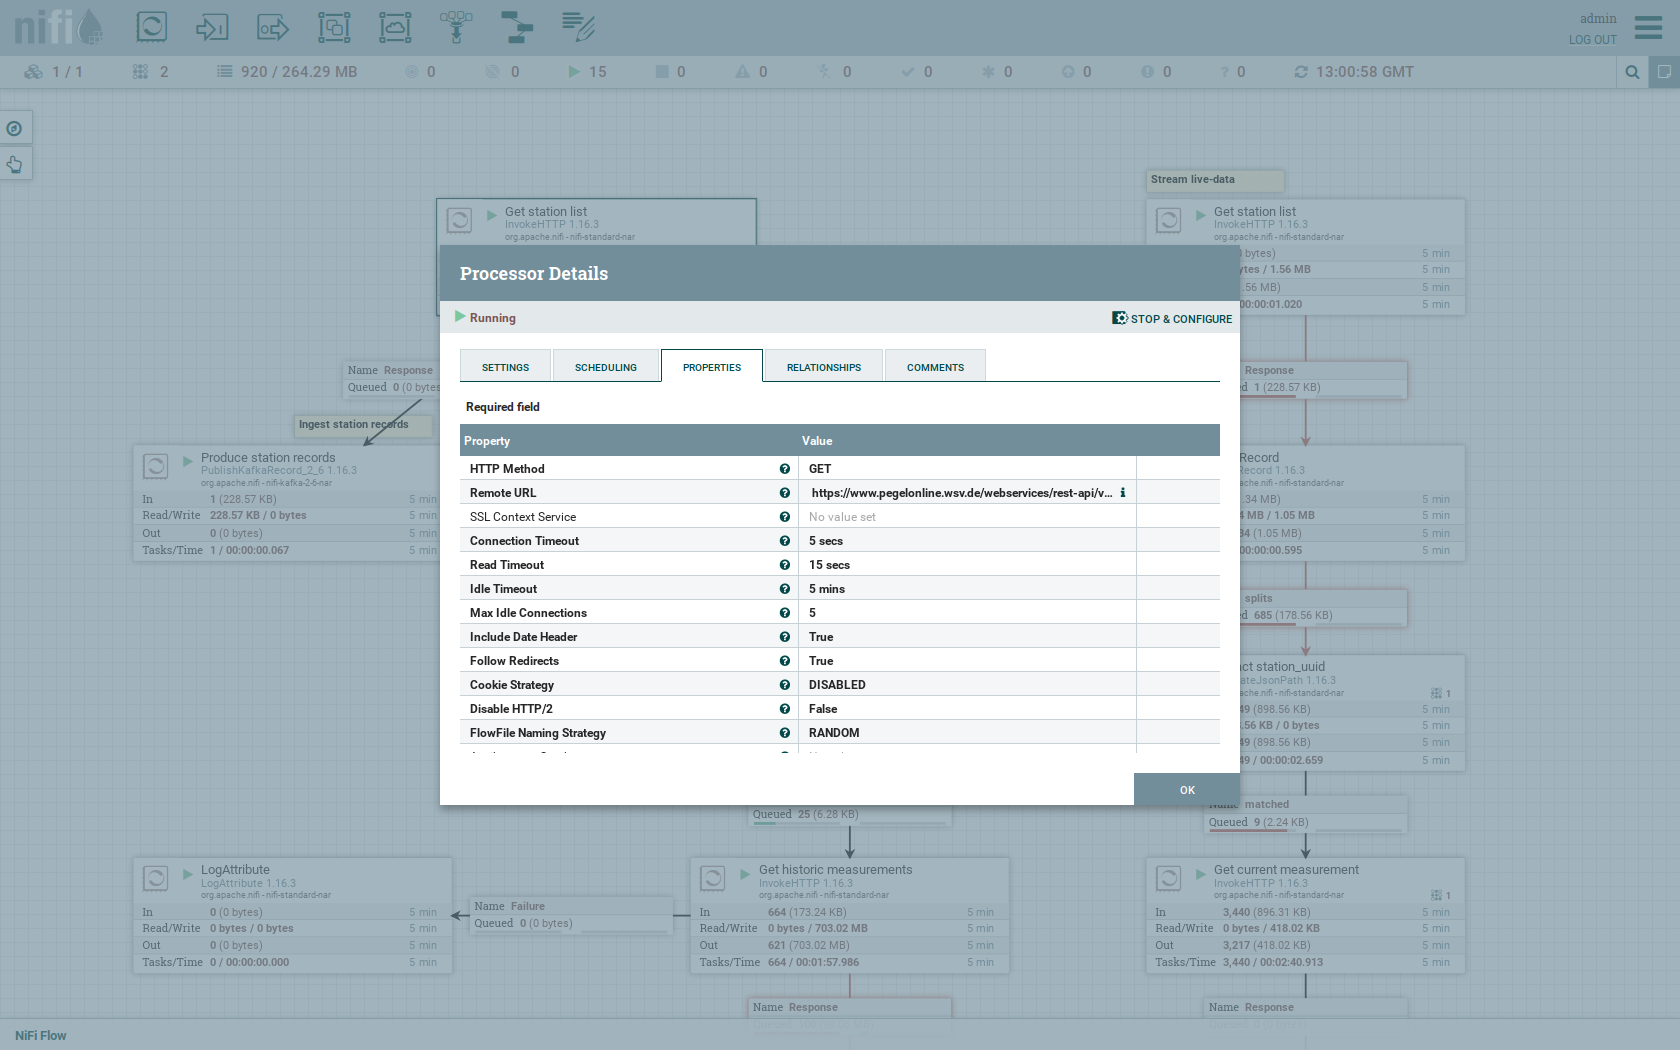
Here you can see the setting Remote URl, which specifies the download URL from where the JSON file containing the stations is retrieved.
Close the processor details popup by clicking OK.
You can also have a detailed view of the Produce station records processor by double-clicking it.
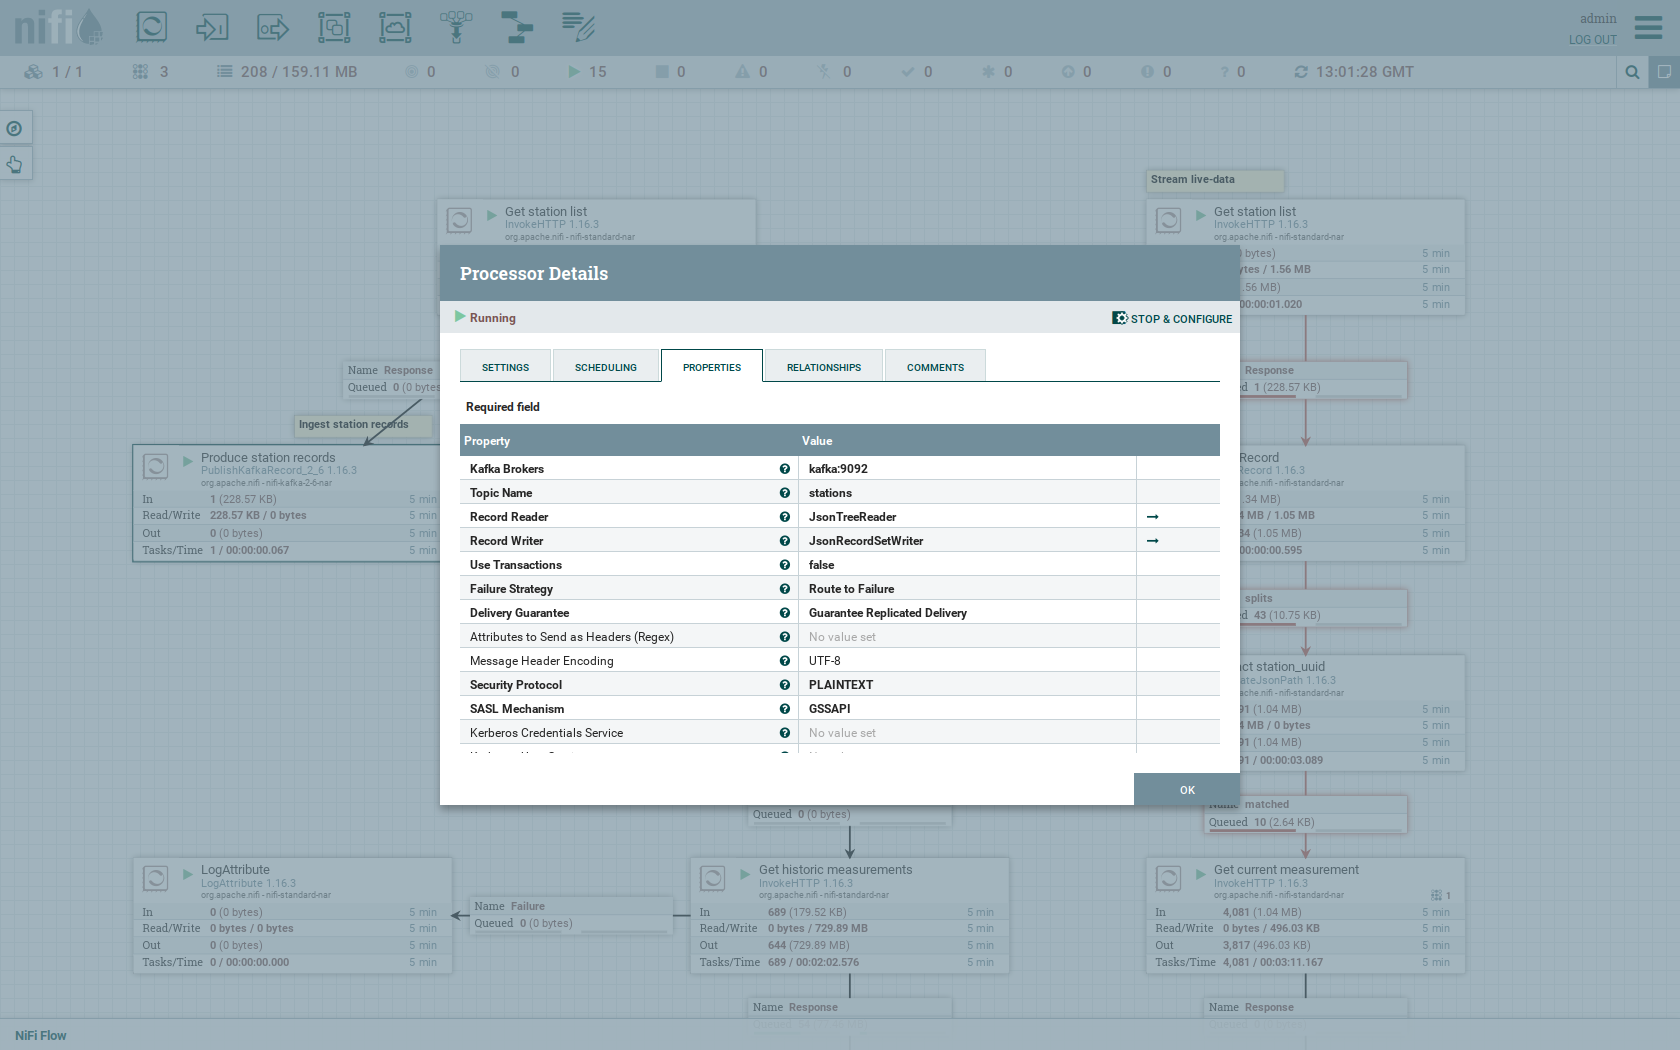
Within this processor the Kafka connection details - like broker addresses and topic name - are specified.
It uses the JsonTreeReader to parse the downloaded JSON and the JsonRecordSetWriter to split it into individual JSON records before writing it out.
Double-click the Get historic measurements processor.
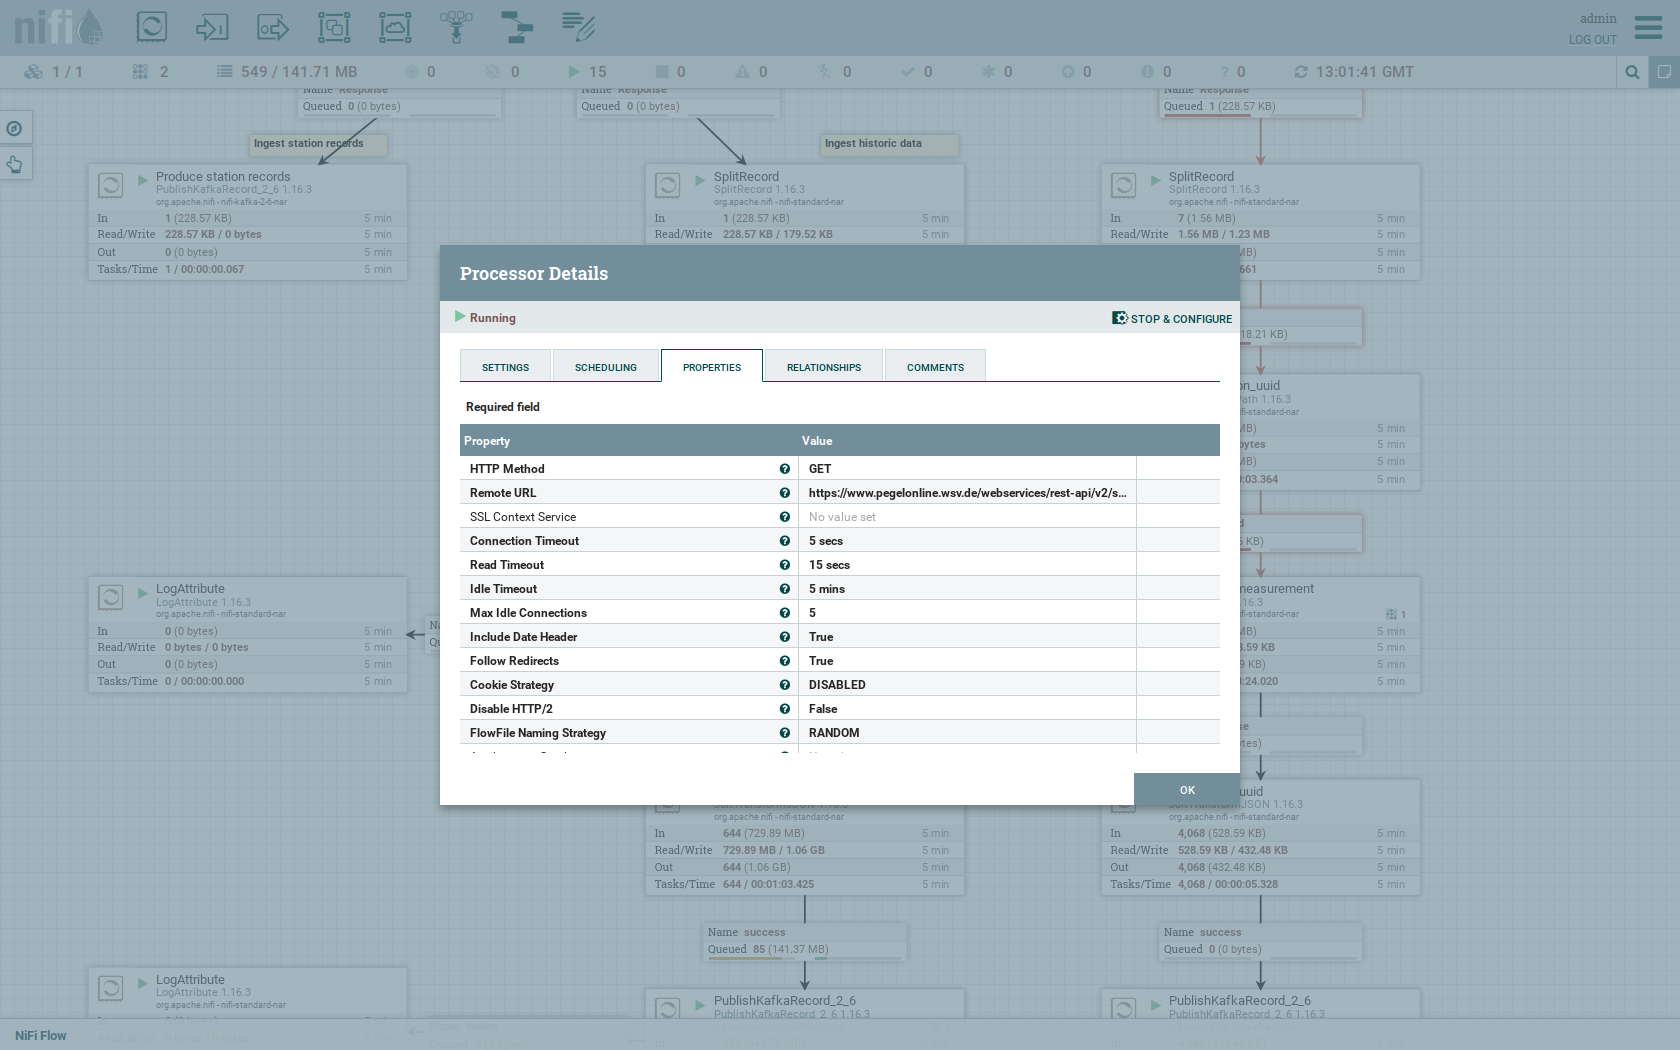
This processor fetched the historical data for every station.
Click on the Remote URL property.
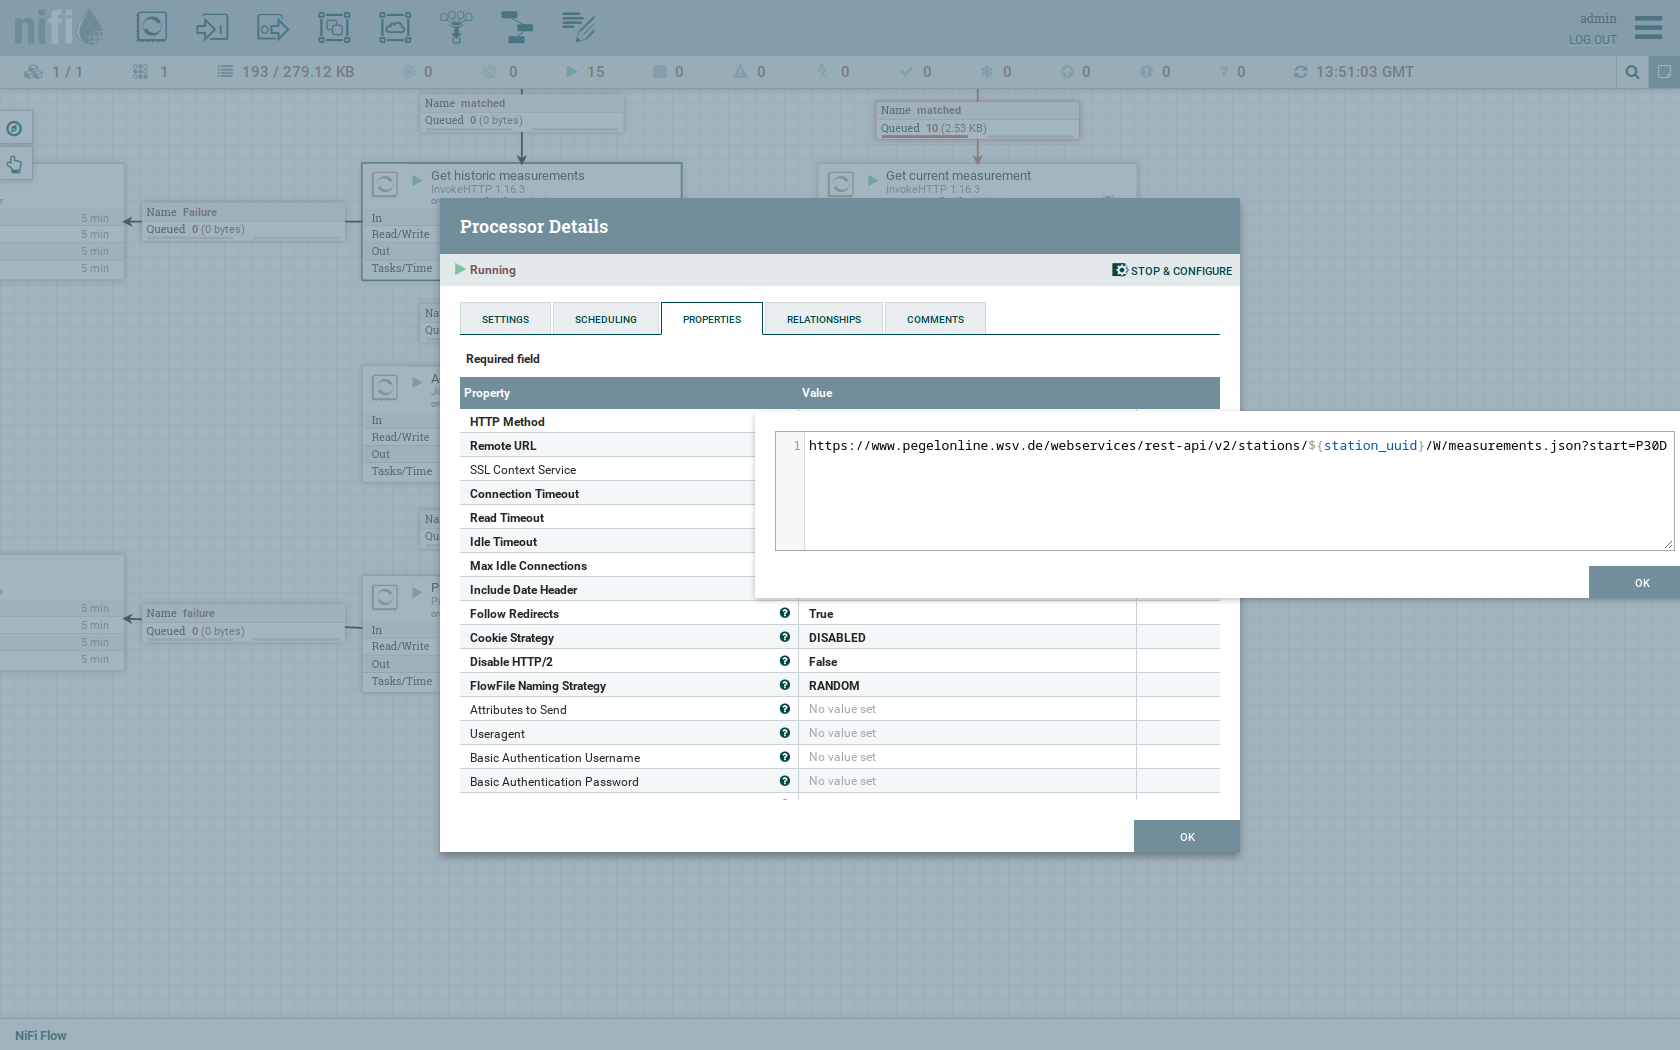
The Remote URL does contain the ${station_uuid} placeholder, which get’s replaced for every station.
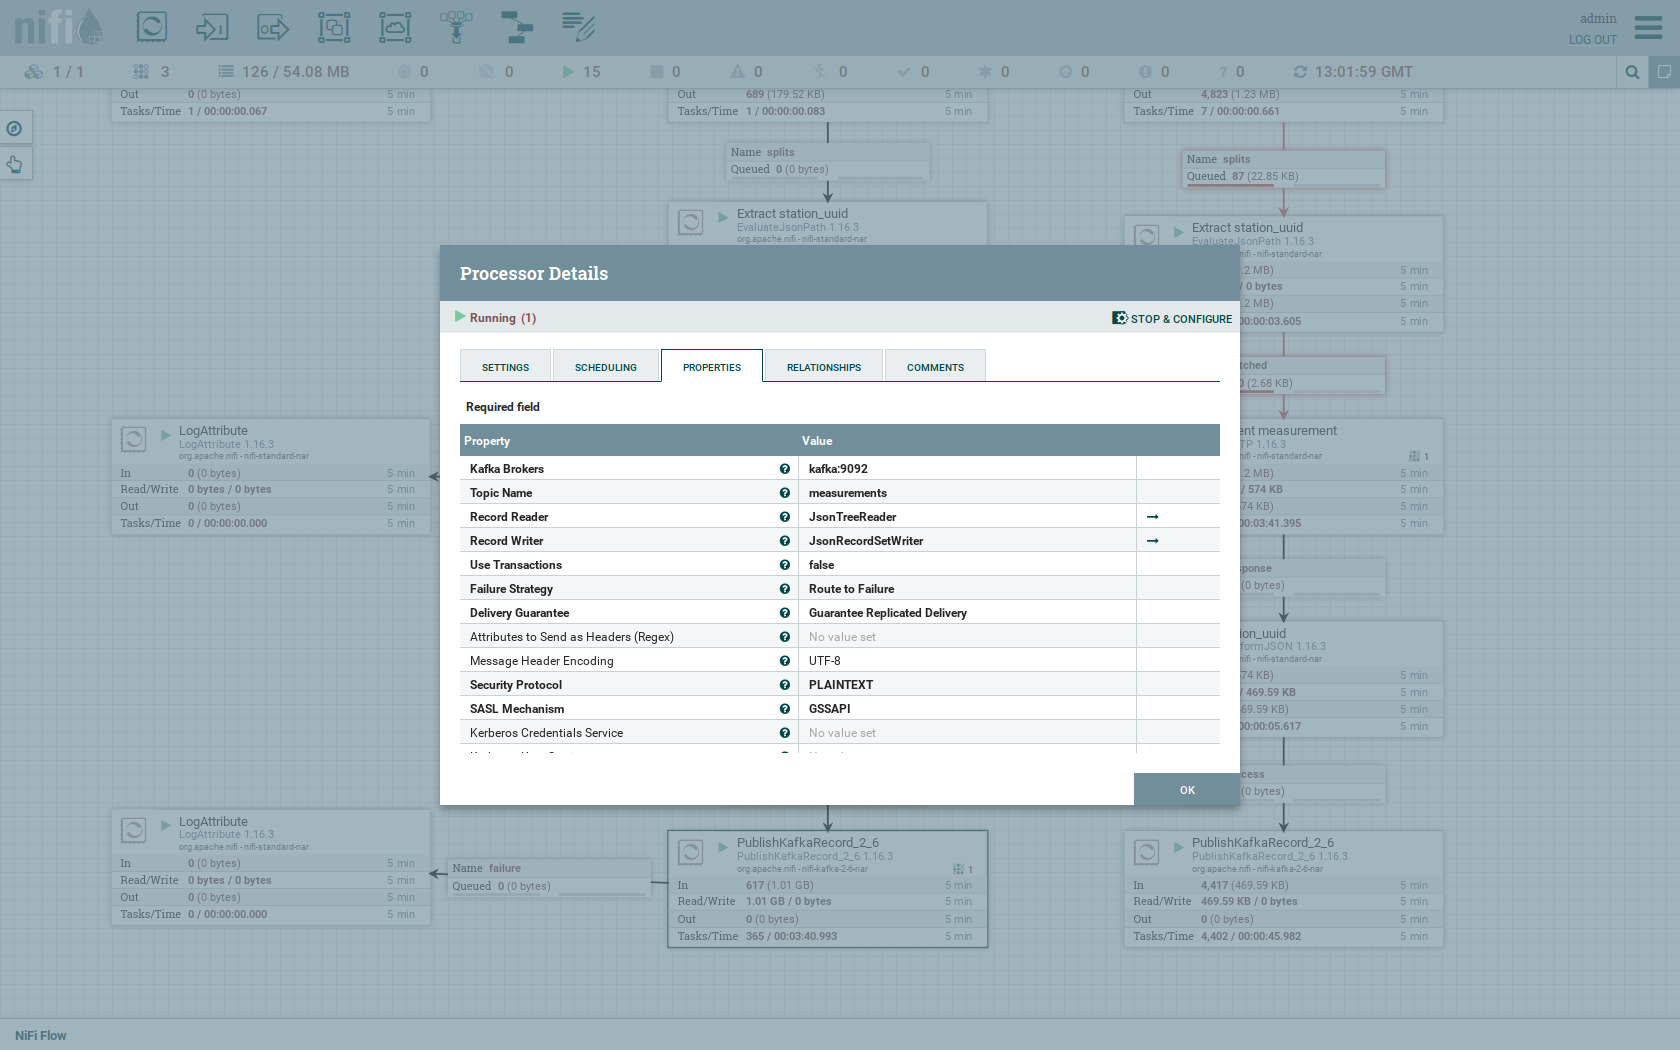
Double-click the PublishKafkaRecord_2_6 processor.
You can also see the number of produced records by right-clicking on PublishKafkaRecord_2_6 and selecting View status history.
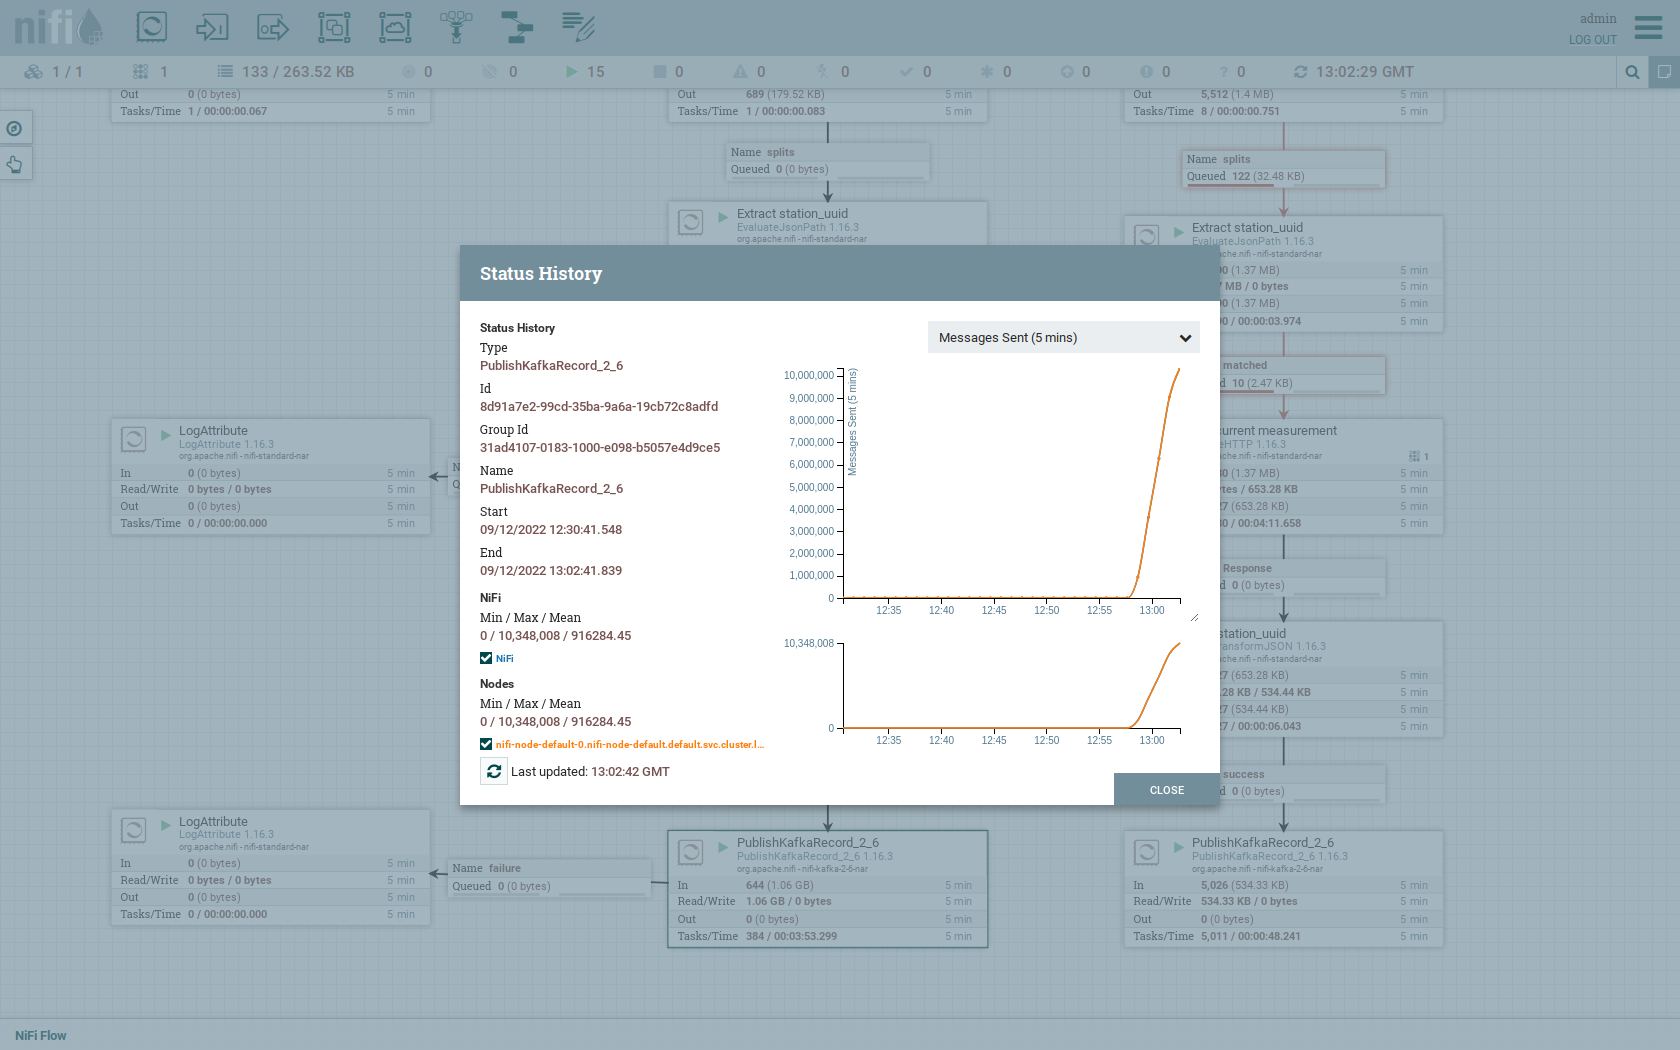
You have to choose Messages Send (5 mins) in the top right corner.
Afterwards you can see that ~10 million records got produced in ~5 minutes, which corresponds to ~30k measurements/s.
Keep in mind that the demos uses a single-node NiFi setup, the performance can been increased by using multiple Nodes.
Speaking of the NiFi resources, on the top right corner use the hamburger menu icon and select Node Status History.
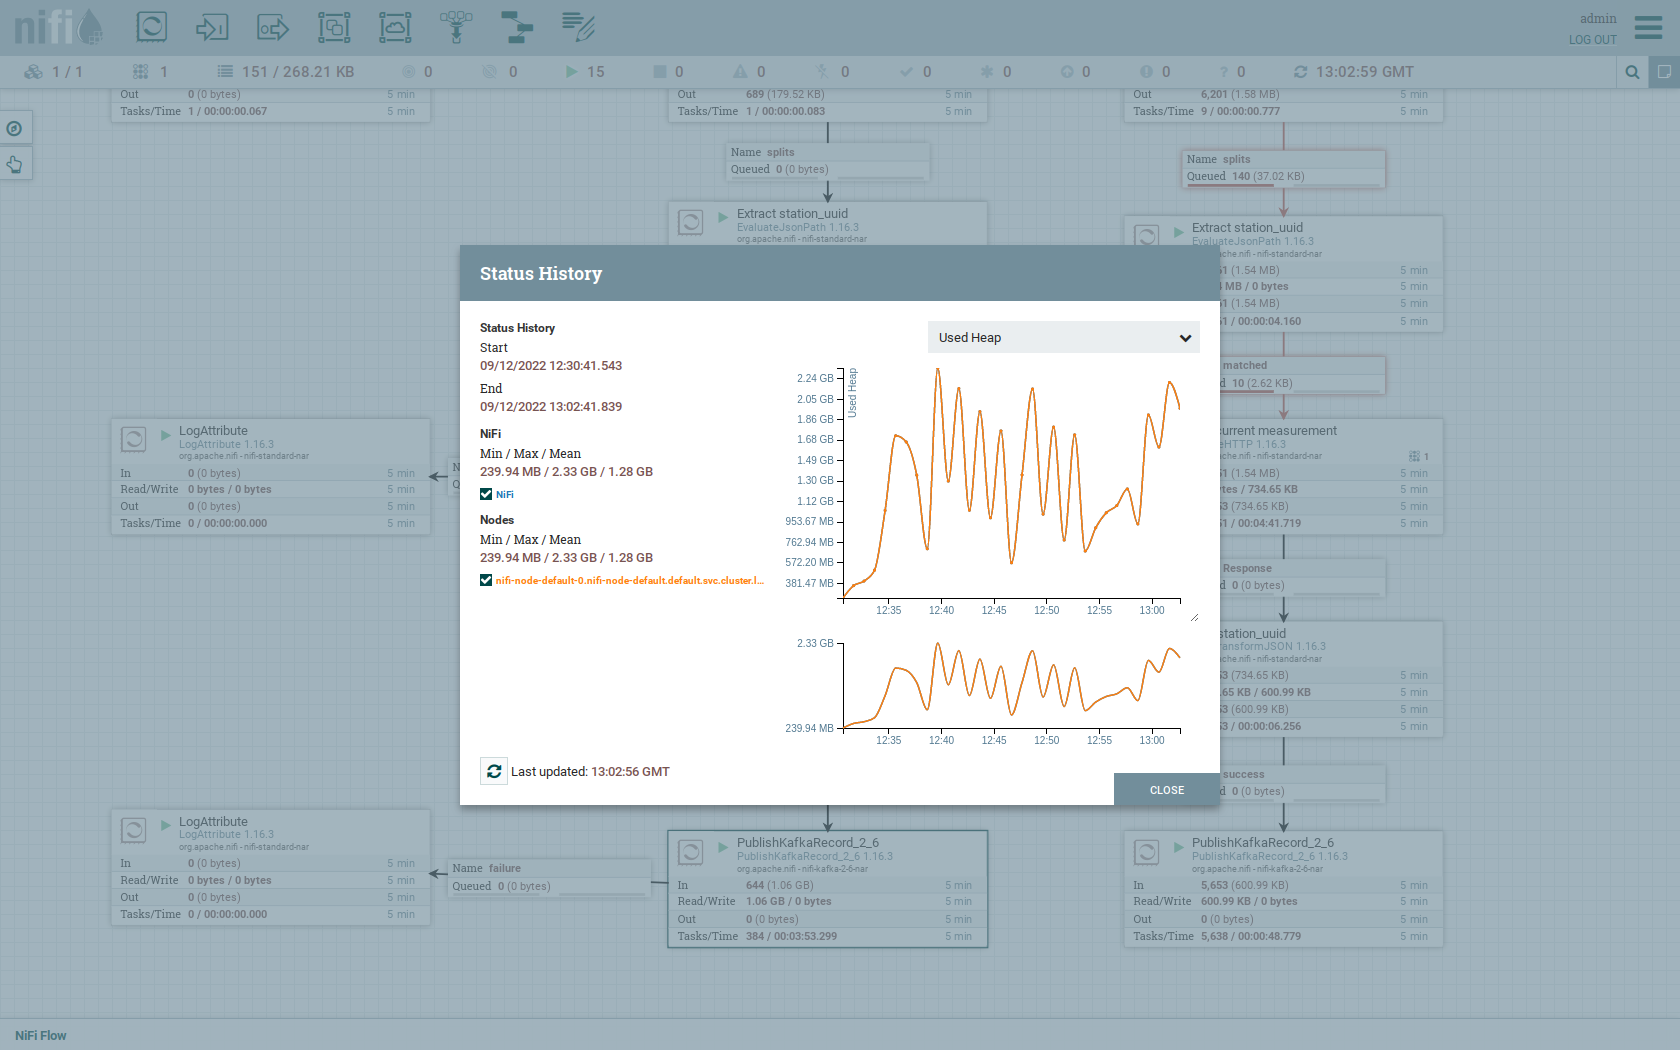
The diagram shows the used heap size of the NiFi node. You can also select other metrics to show in the top right corner.
Druid
Druid is used to ingest the near real-time data from Kafka, store it and enable SQL access to it.
The demo has started two ingestion jobs - one reading from the topic stations and the other from measurements - and saving it into Druids deep storage.
The Druid deep storage is based on the S3 store provided by MinIO.
View ingestion job
You can have a look at the ingestion jobs running in Druid by opening the given druid endpoint router-http from your stackablectl services list command output (http://172.18.0.4:30899 in this case).
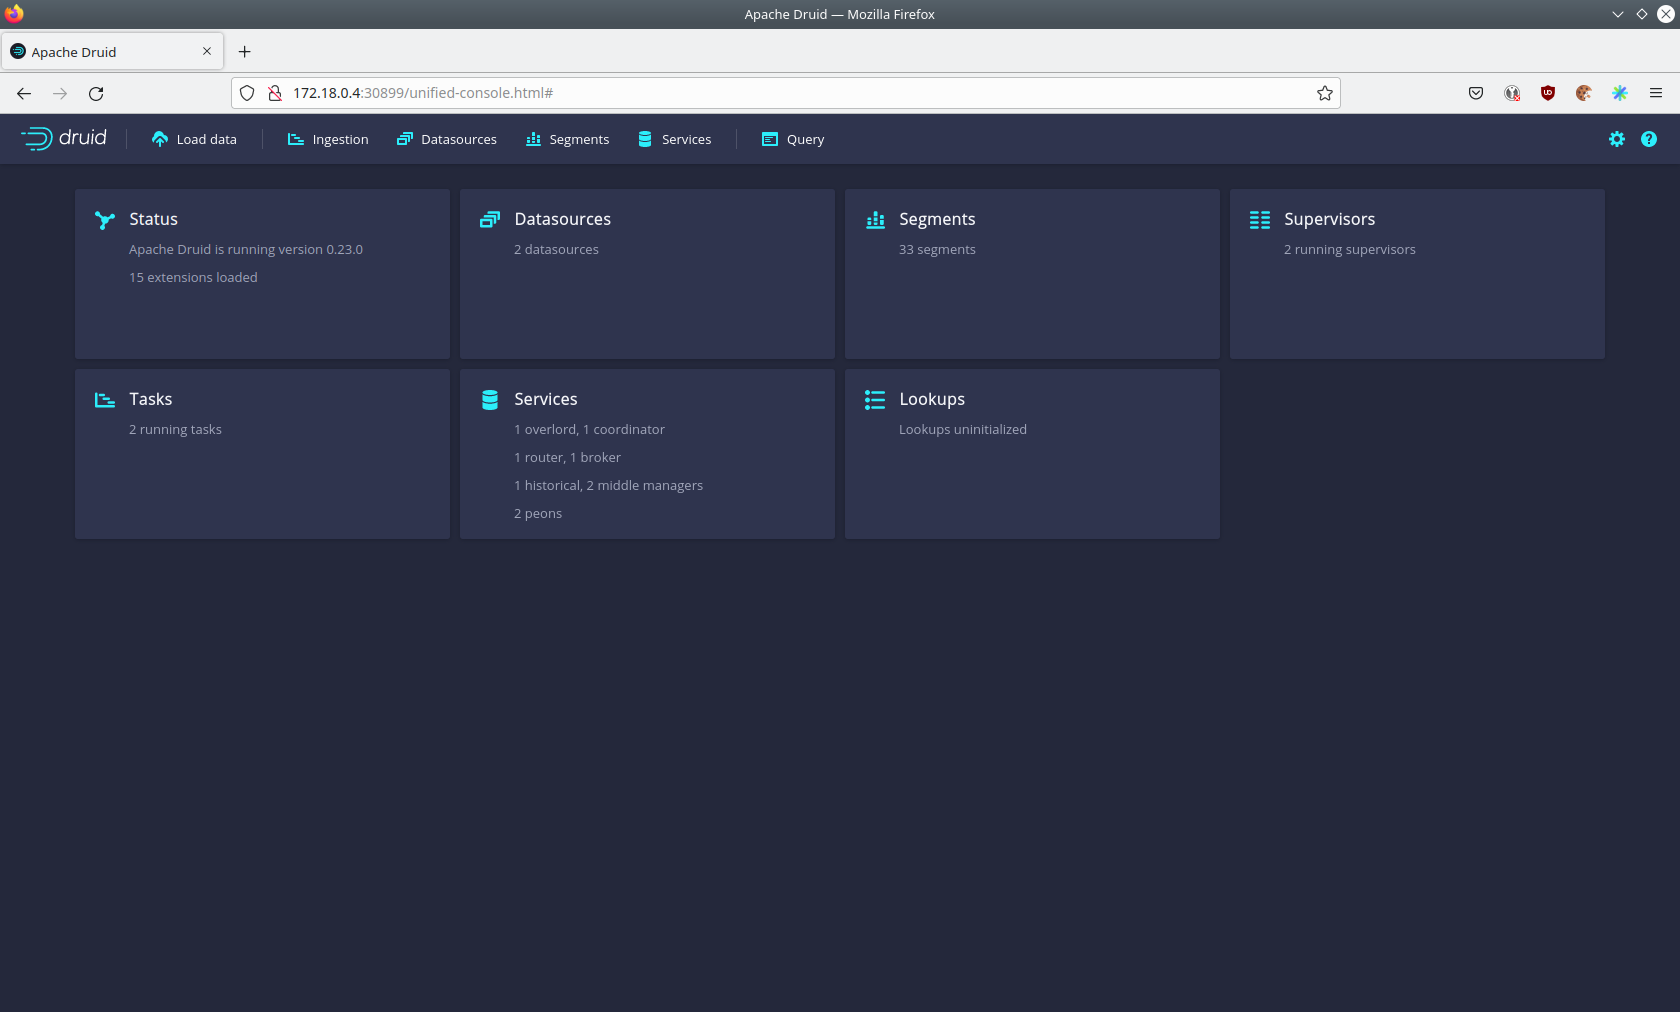
By clicking on Ingestion at the top you can see the running ingestion jobs.
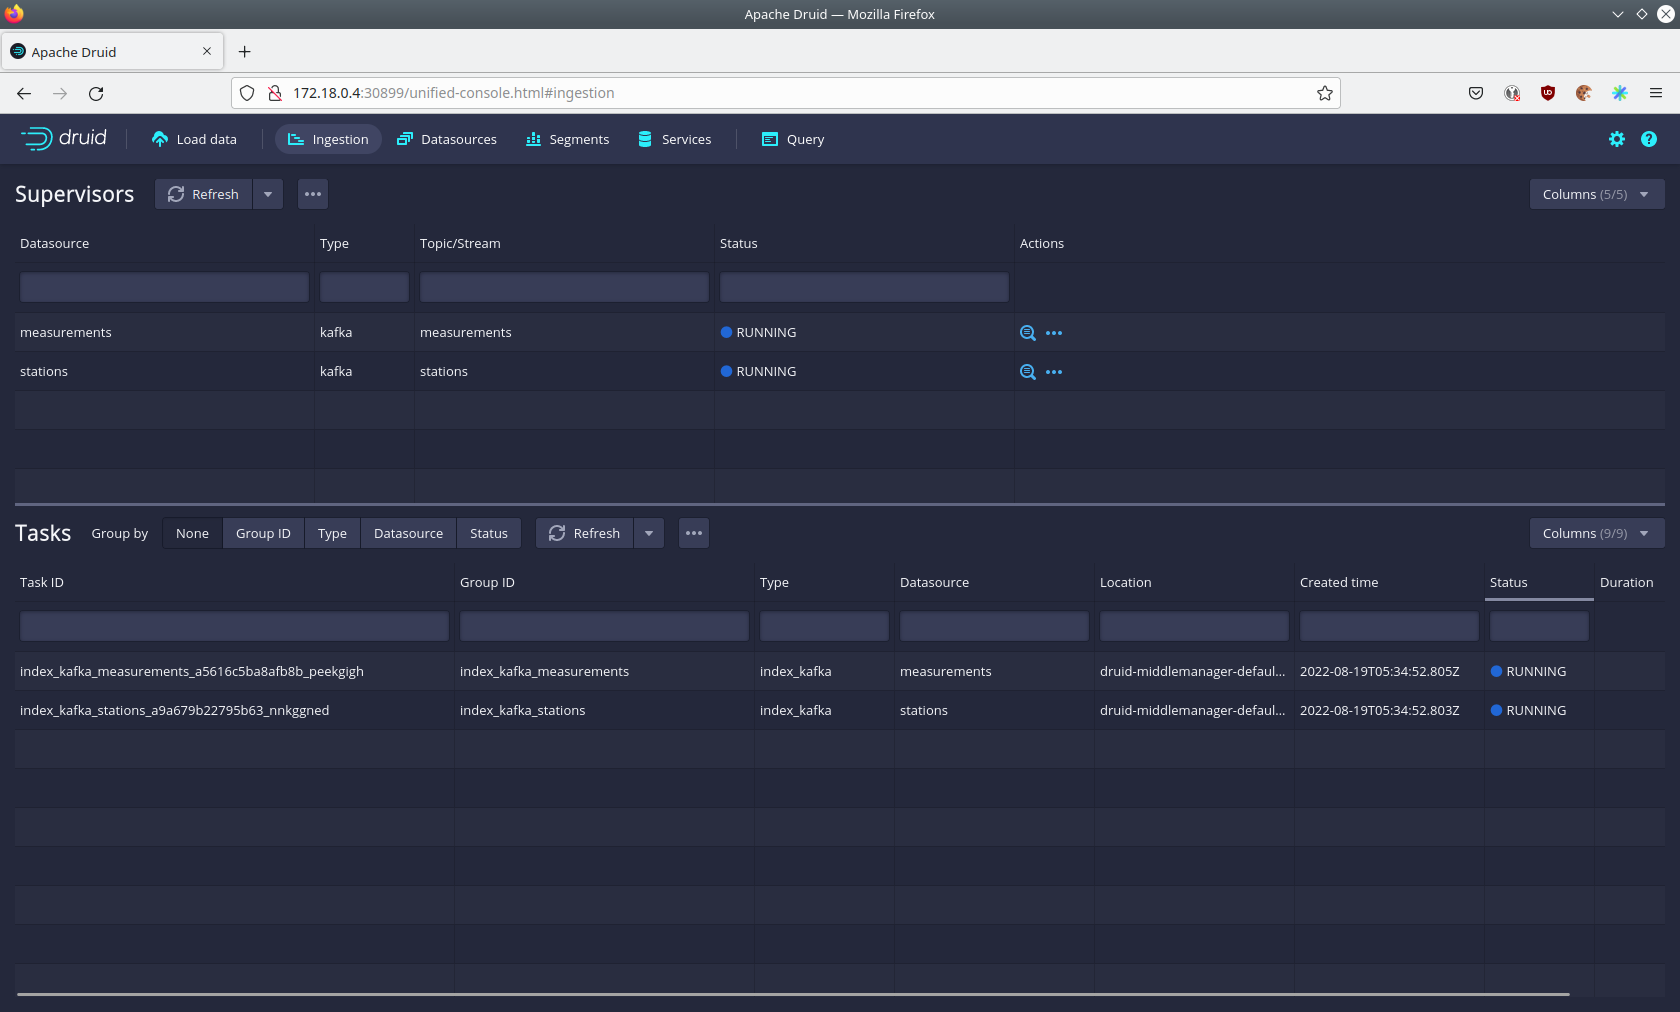
After clicking on the magnification glass to the right side of the RUNNING supervisor you can see additional information (here the supervisor measurements was chosen).
On the tab Statistics on the left you can see the number of processed records as well as the number of errors.
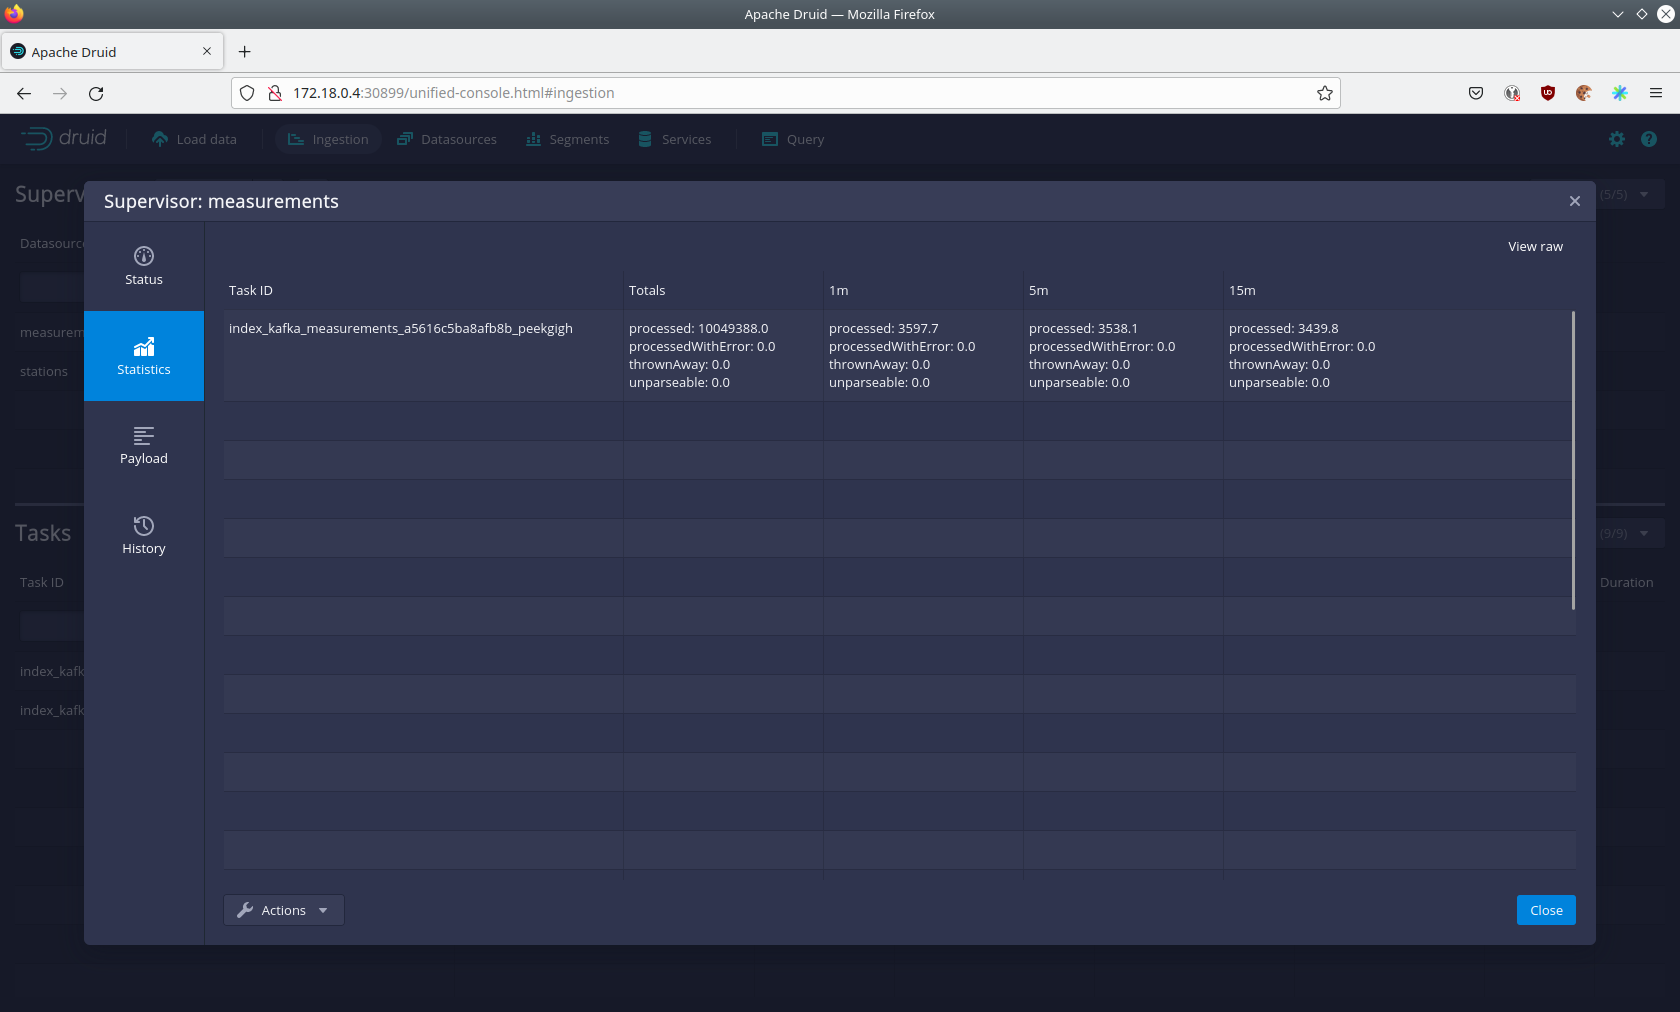
The statistics show that Druid is currently ingesting 3597 records/s and has ingested ~10 million records so far.
All records have been ingested successfully, which is indicated by having no processWithError, thrownAway or unparseable records.
Query the data source
The started ingestion jobs have automatically created the Druid data sources stations and measurements.
You can see the available data sources by clicking on Datasources at the top.
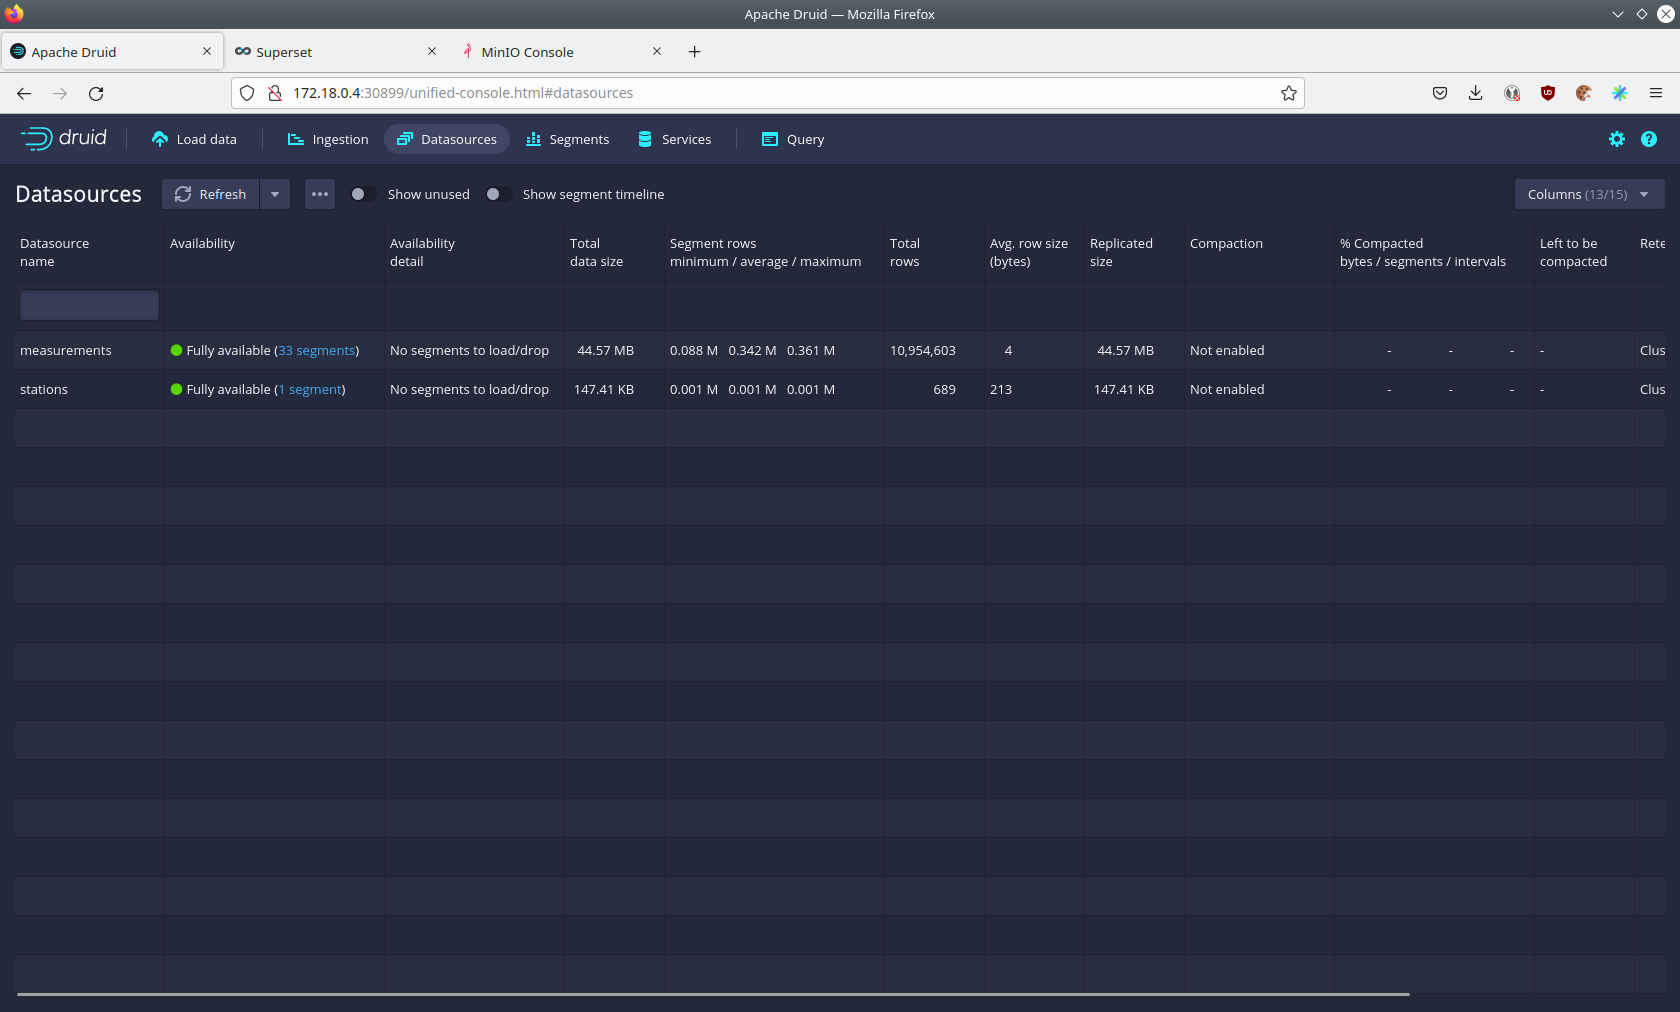
The Avg. row size (bytes) shows, that a typical measurement record has 4 bytes, while a station record has 213 bytes, which is more than 50 times the size.
So with choosing two dedicated topics over a single topic, this demo was able to save 50x of storage and computation costs.
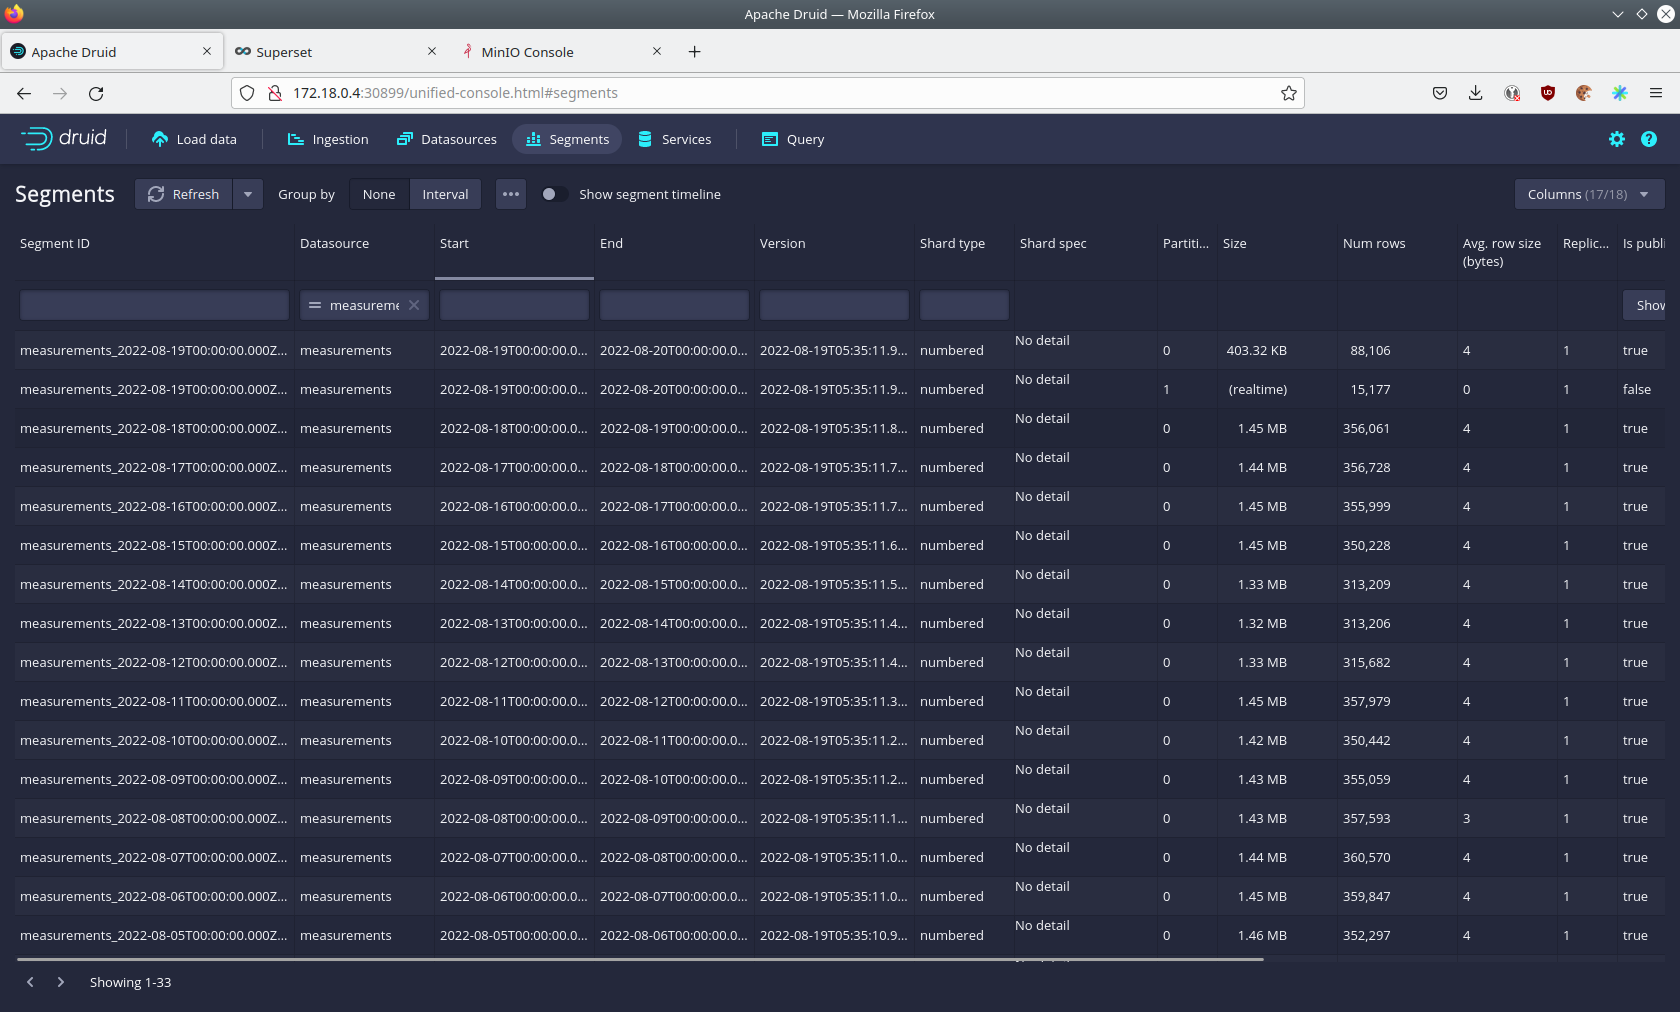
By clicking on the measurements data source you can see the segments of which the data source consists of.
In this case the measurements data source is partitioned by the day of the measurement, resulting in 33 segments.
Druid offers a web-based way of querying the data sources via SQL.
To achieve this you first have to click on Query at the top.
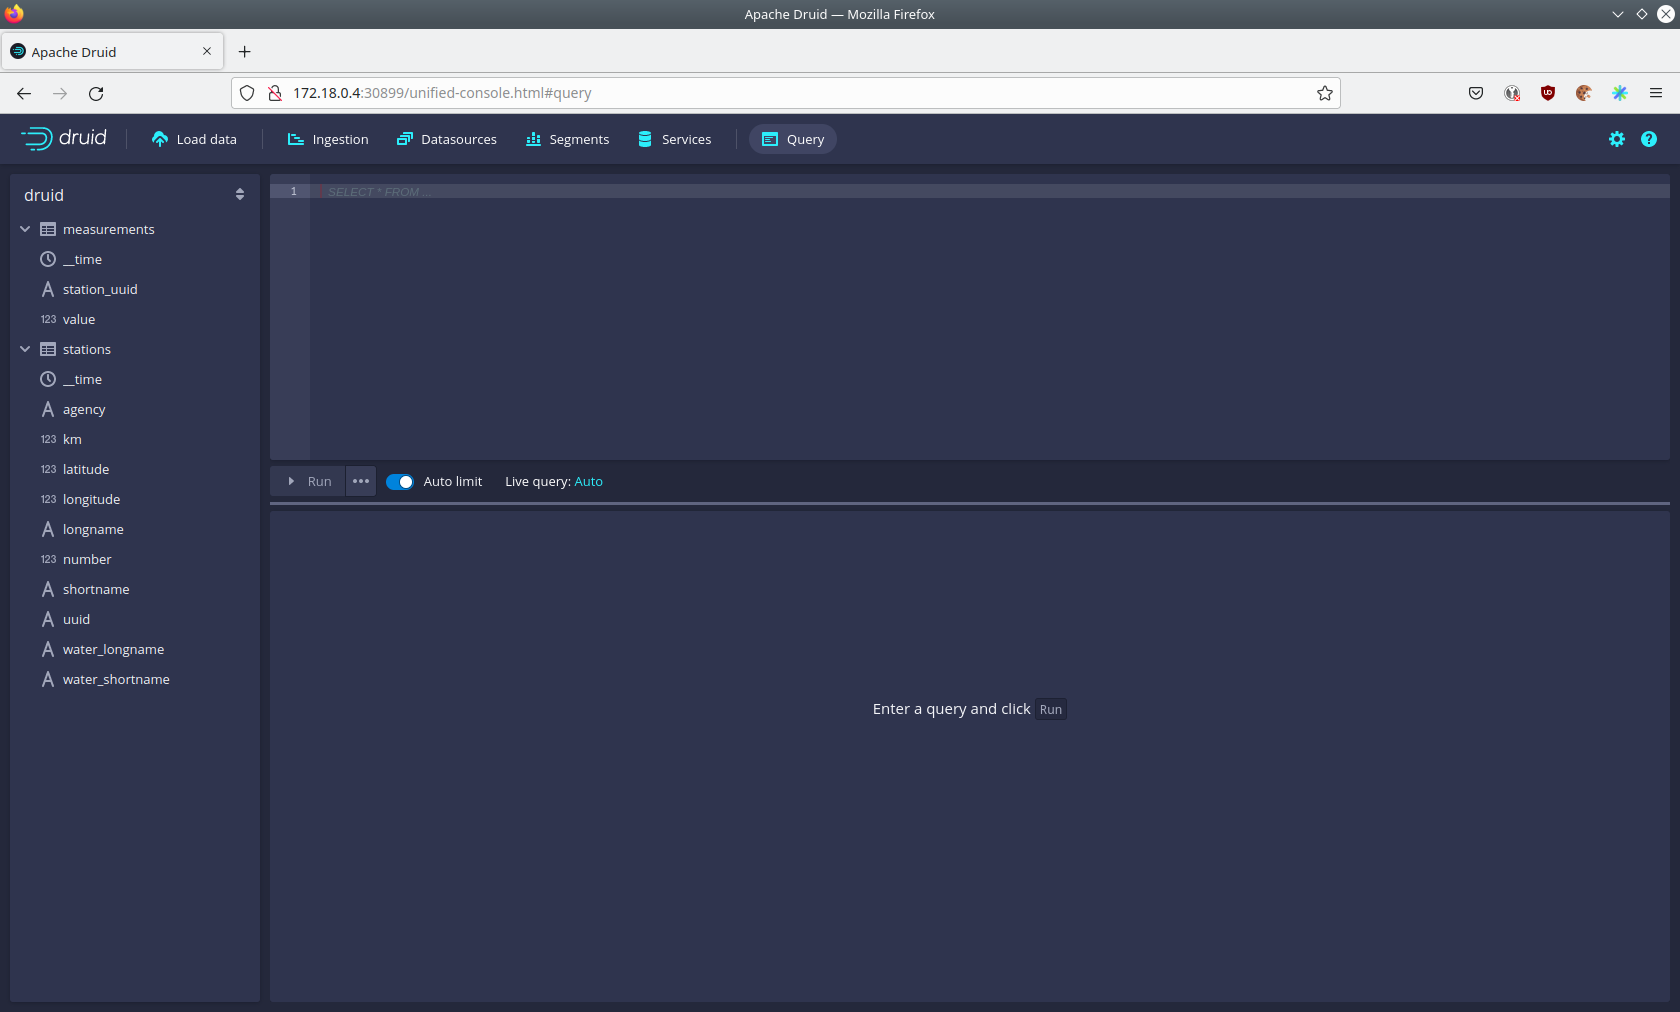
You can now enter any arbitrary SQL statement, to e.g. list 10 stations run
select * from stations limit 10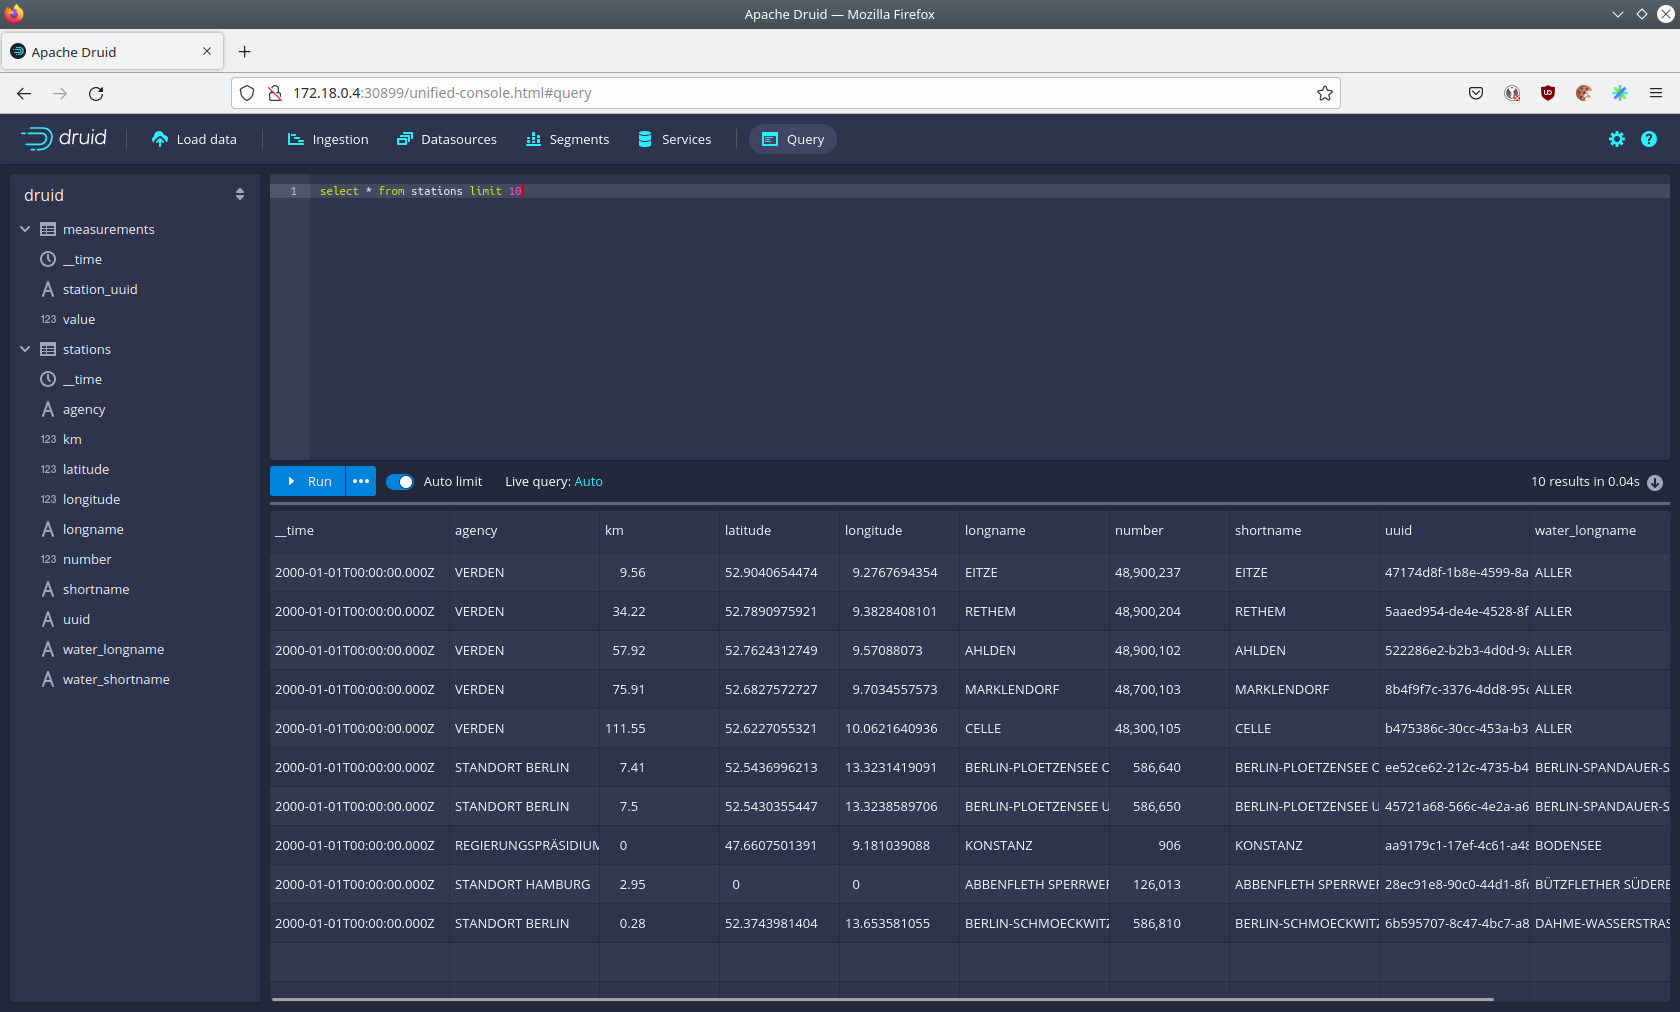
To count the measurements per day run
select
  time_format(__time, 'YYYY/MM/dd') as "day",
  count(*) as measurements
from measurements
group by 1
order by 1 desc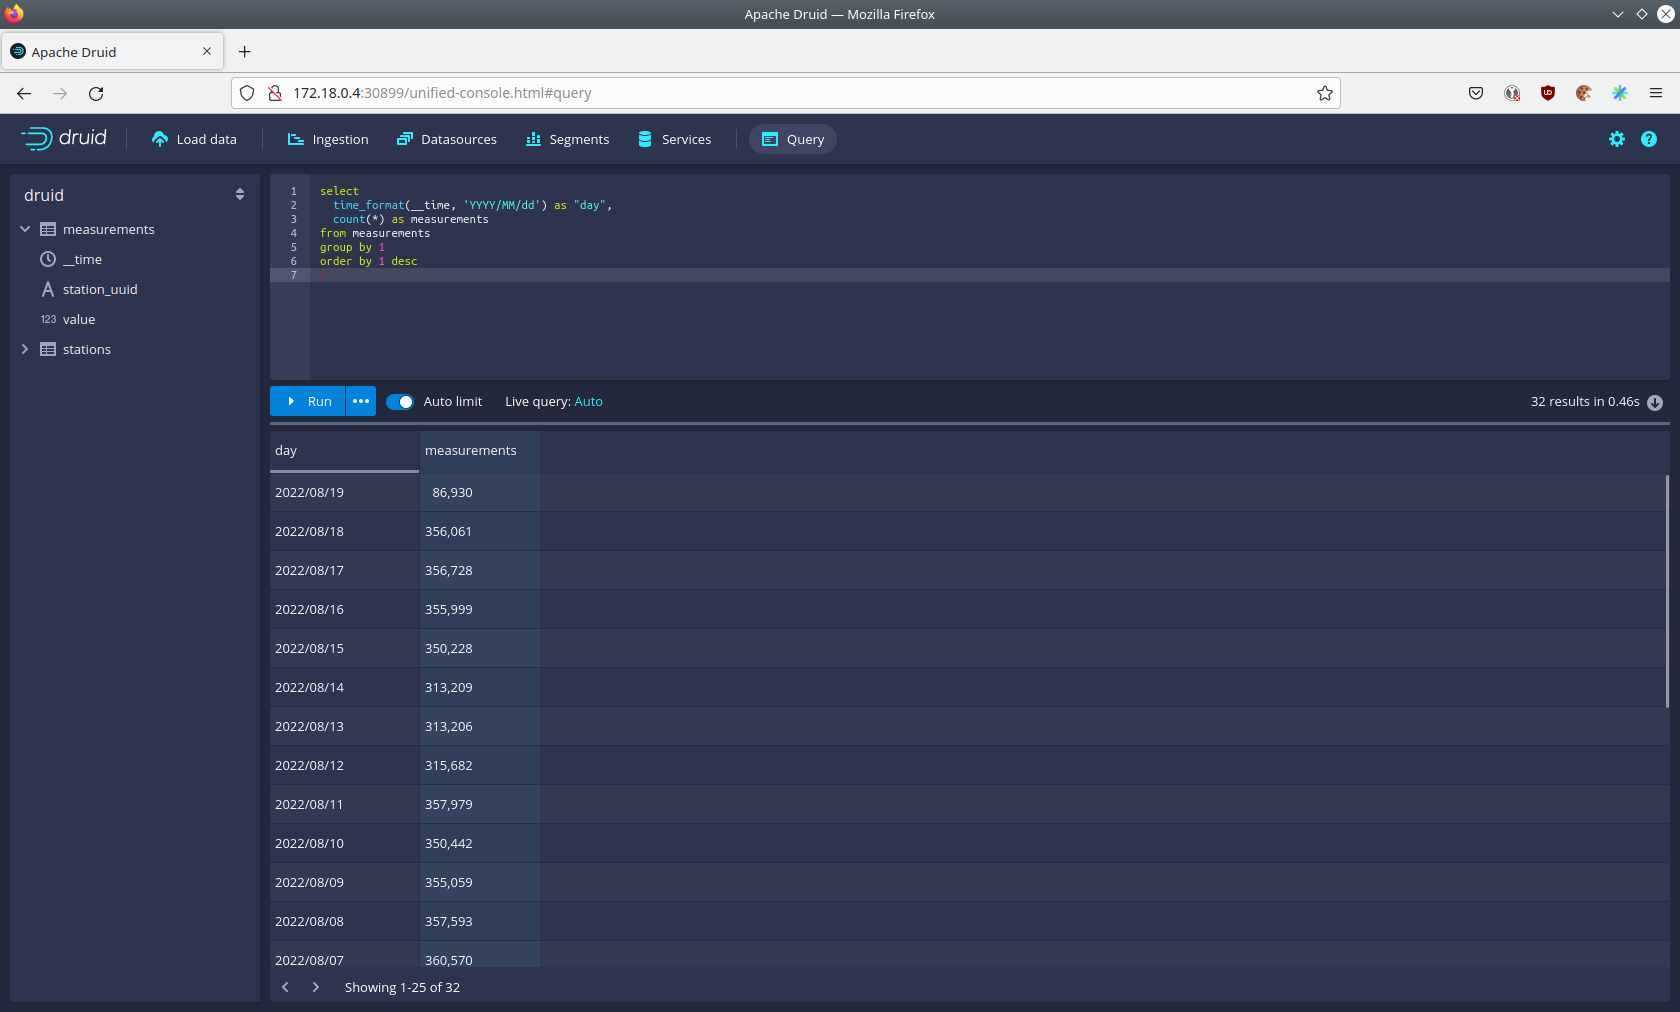
Superset
Superset provides the ability to execute SQL queries and build dashboards.
Open the superset endpoint external-superset in your browser (http://172.18.0.4:32251 in this case).
Log in with the username admin and password adminadmin.
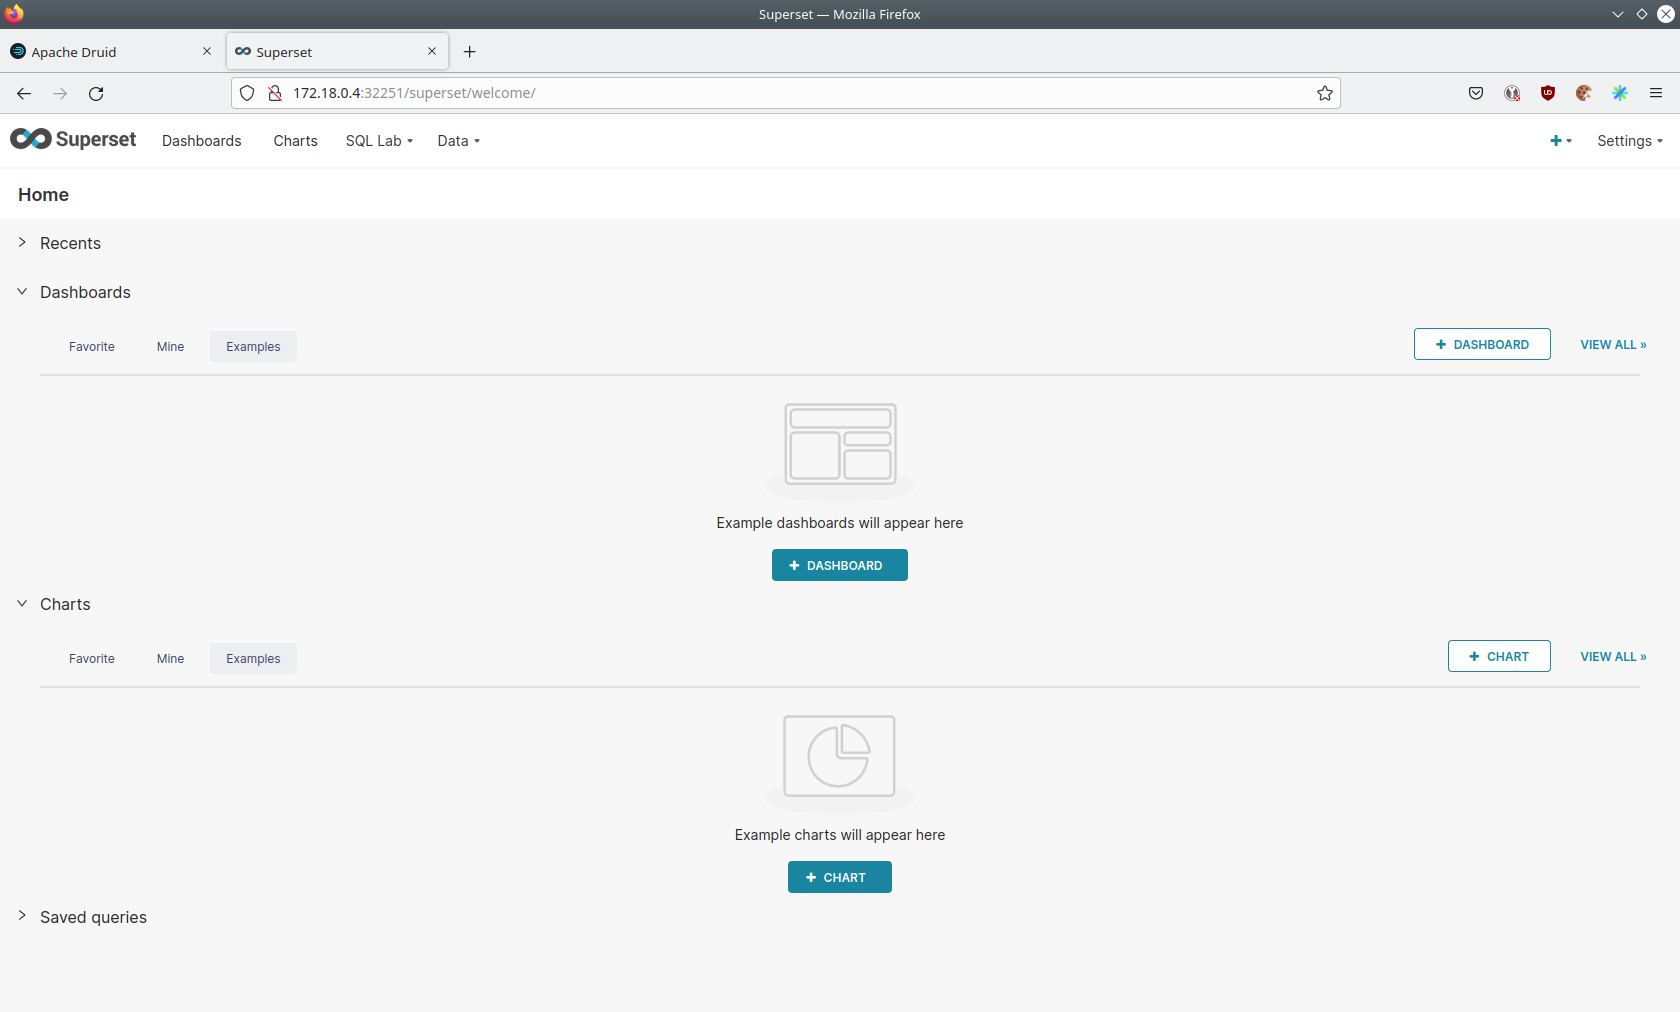
View dashboard
The demo has created a Dashboard to visualize the water level data.
To open it click on the tab Dashboards at the top.
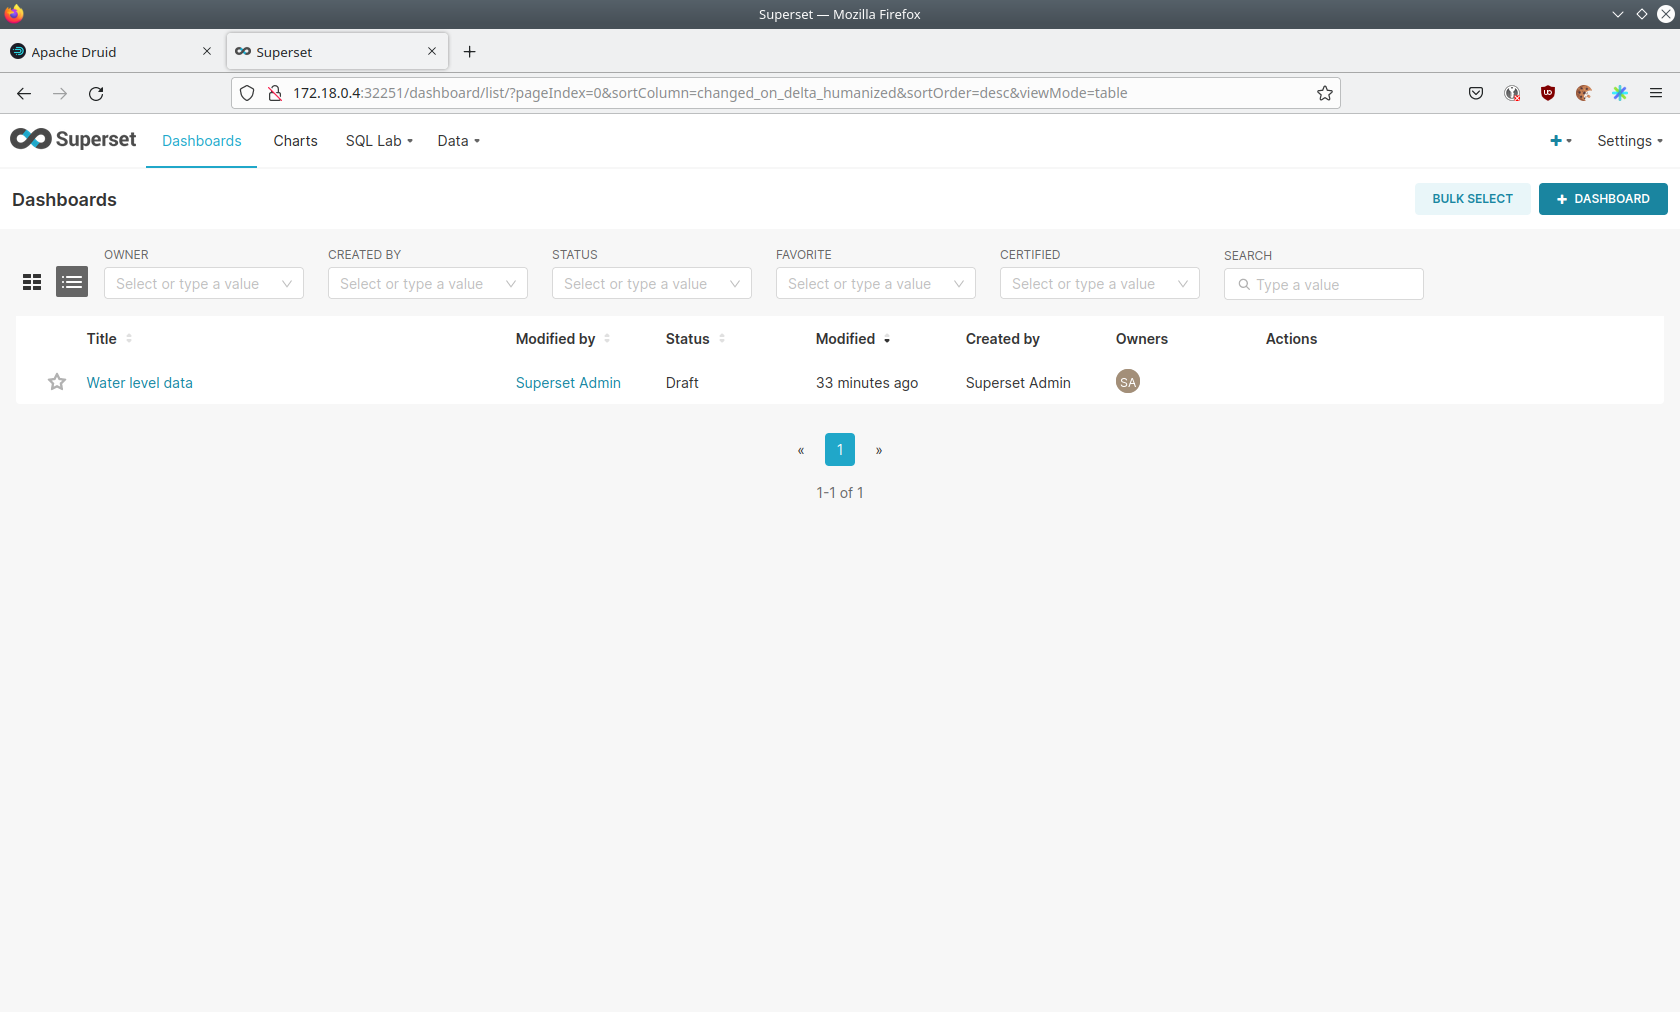
Click on the dashboard called Water level data.
It might take some time until the dashboards renders all the included charts.
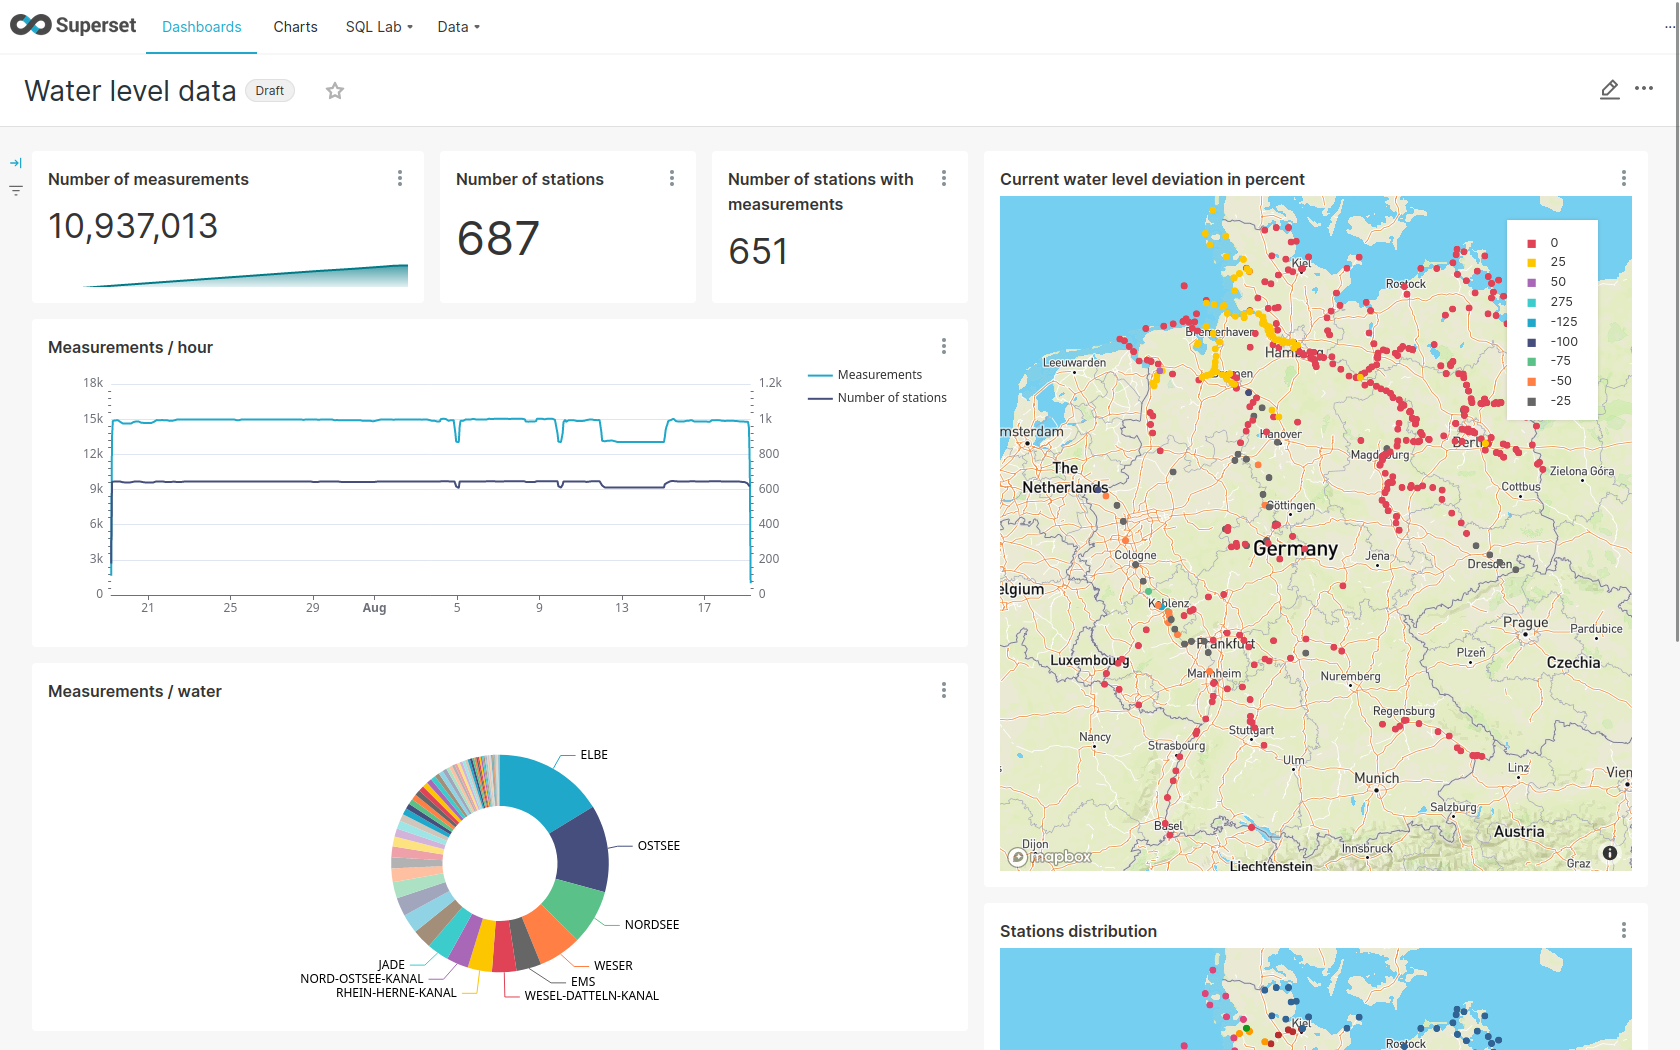
View charts
The dashboard Water level data consists of multiple charts.
To list the charts click on the tab Charts at the top.
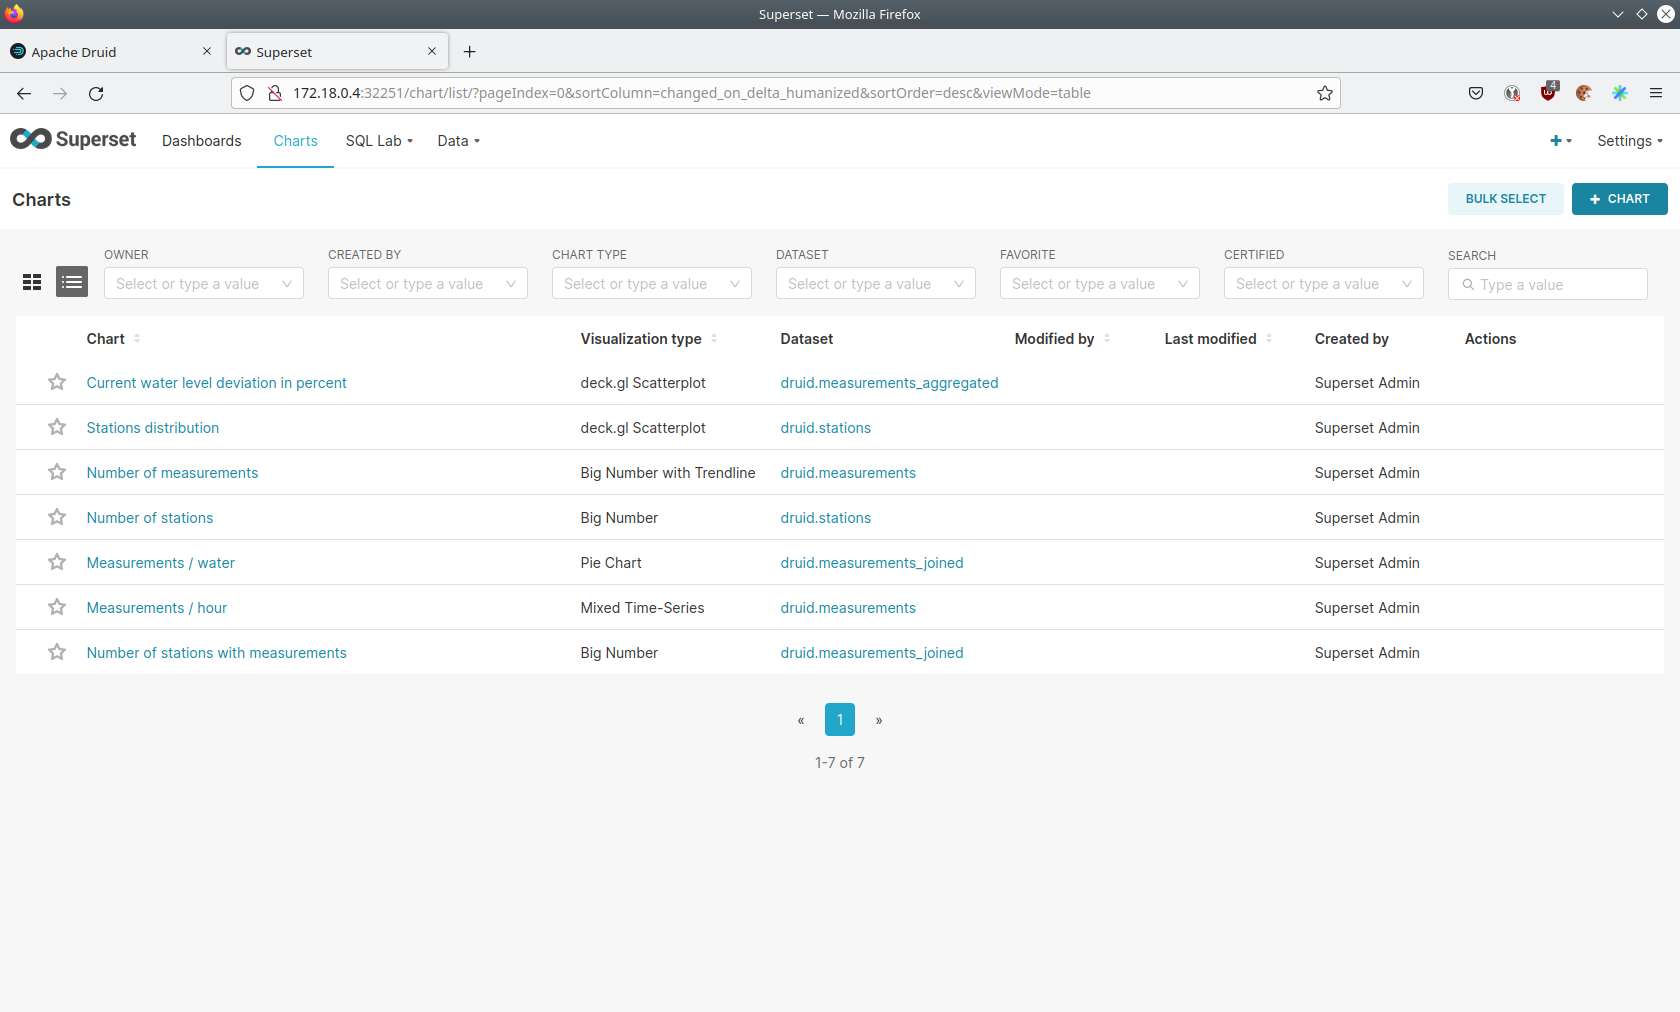
Click on the Chart Measurements / hour.
On the left side you can modify the chart and click on Run to see the effect.
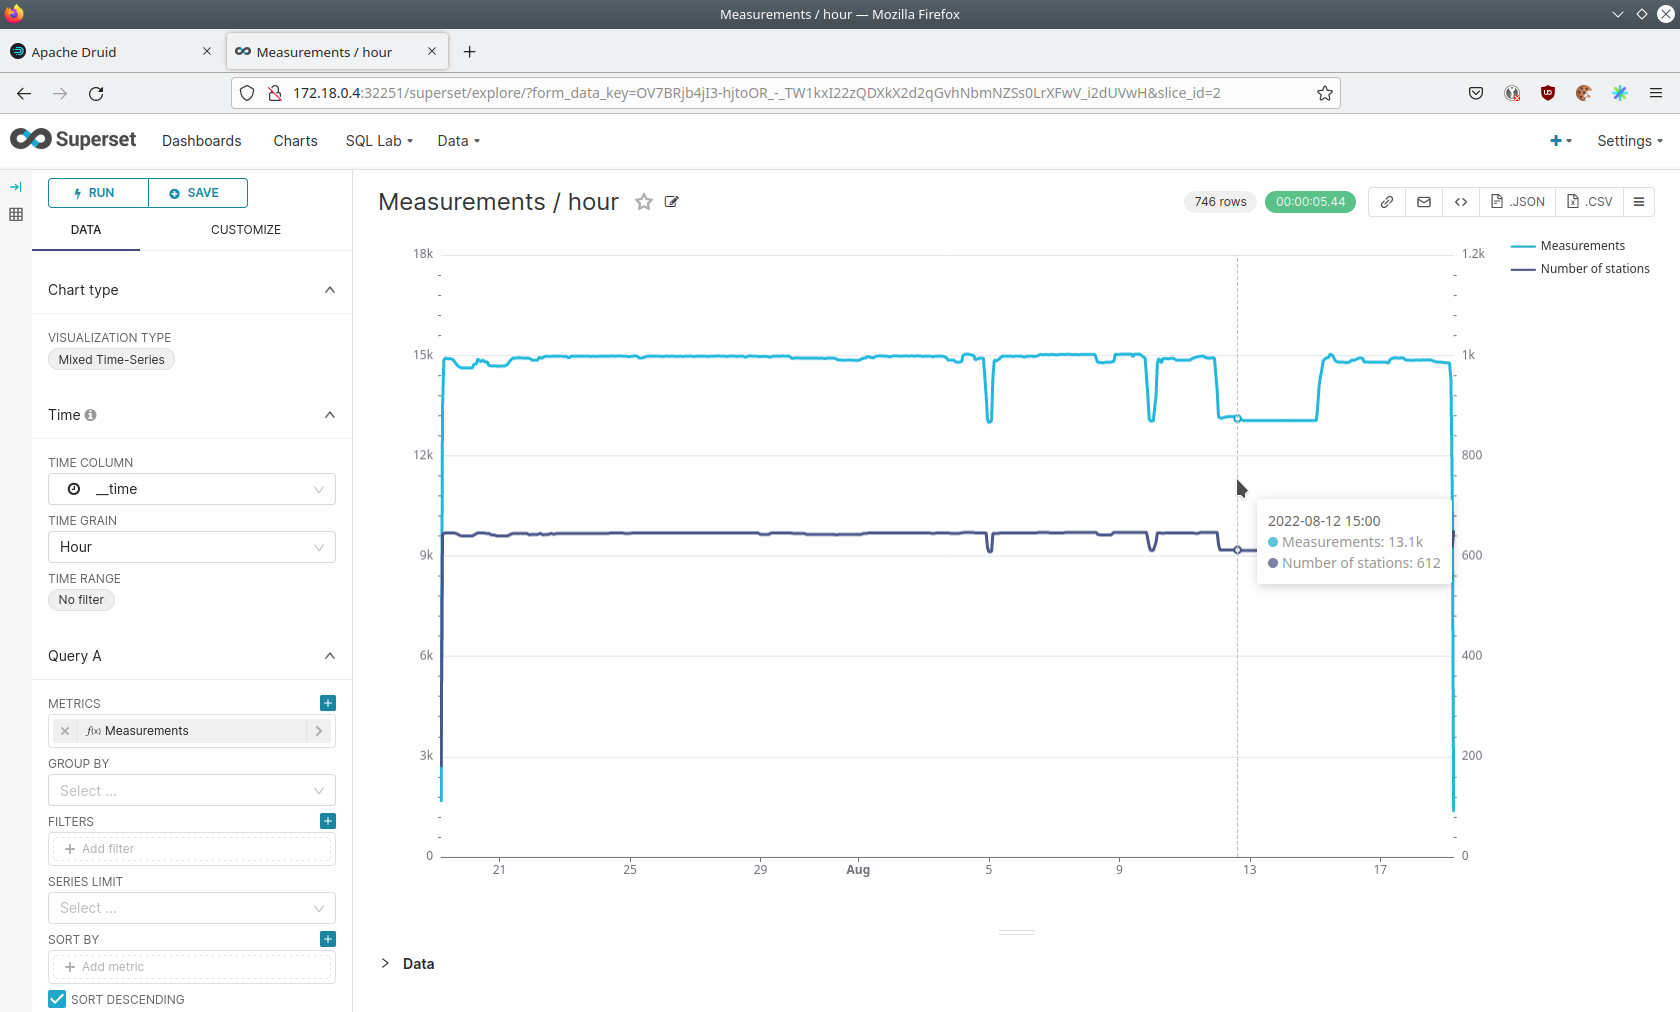
You can see that starting from 2022/08/12 some stations didn’t measure or transmit their data.
They started sending measurements again at 2022/08/14.
View the station distribution on the world map
To look at the geographical distribution of the stations you have to click on the tab Charts at the top again.
Afterwards click on the chart Stations distribution.
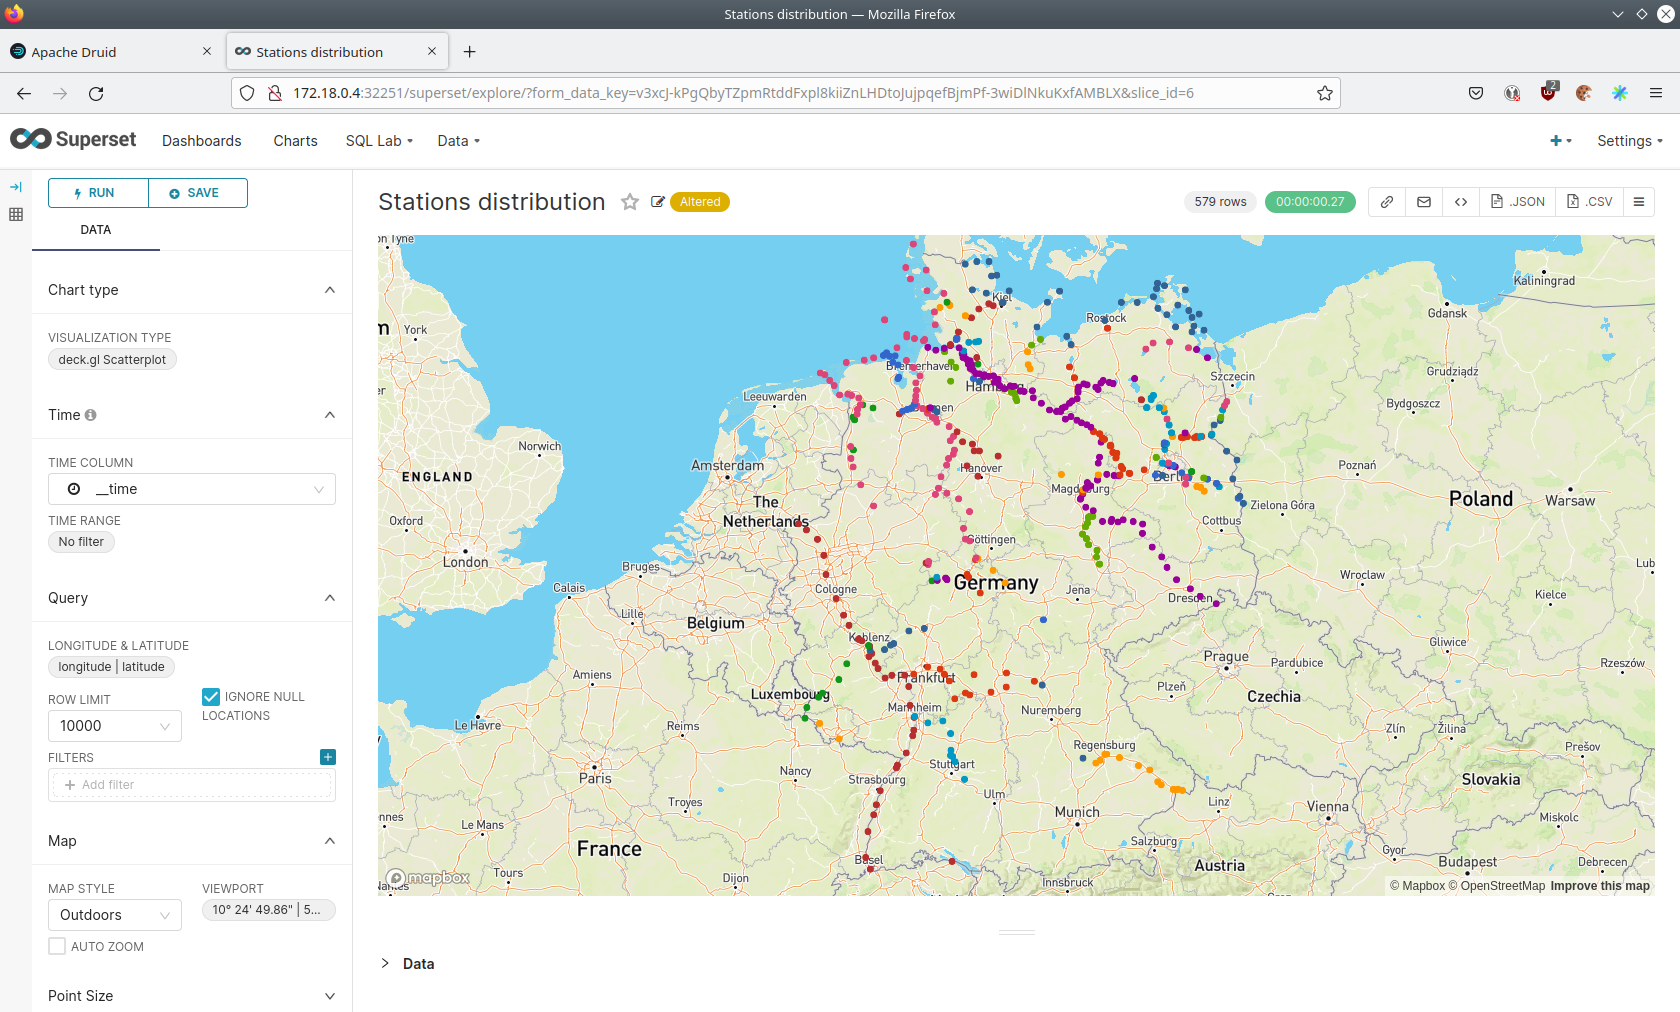
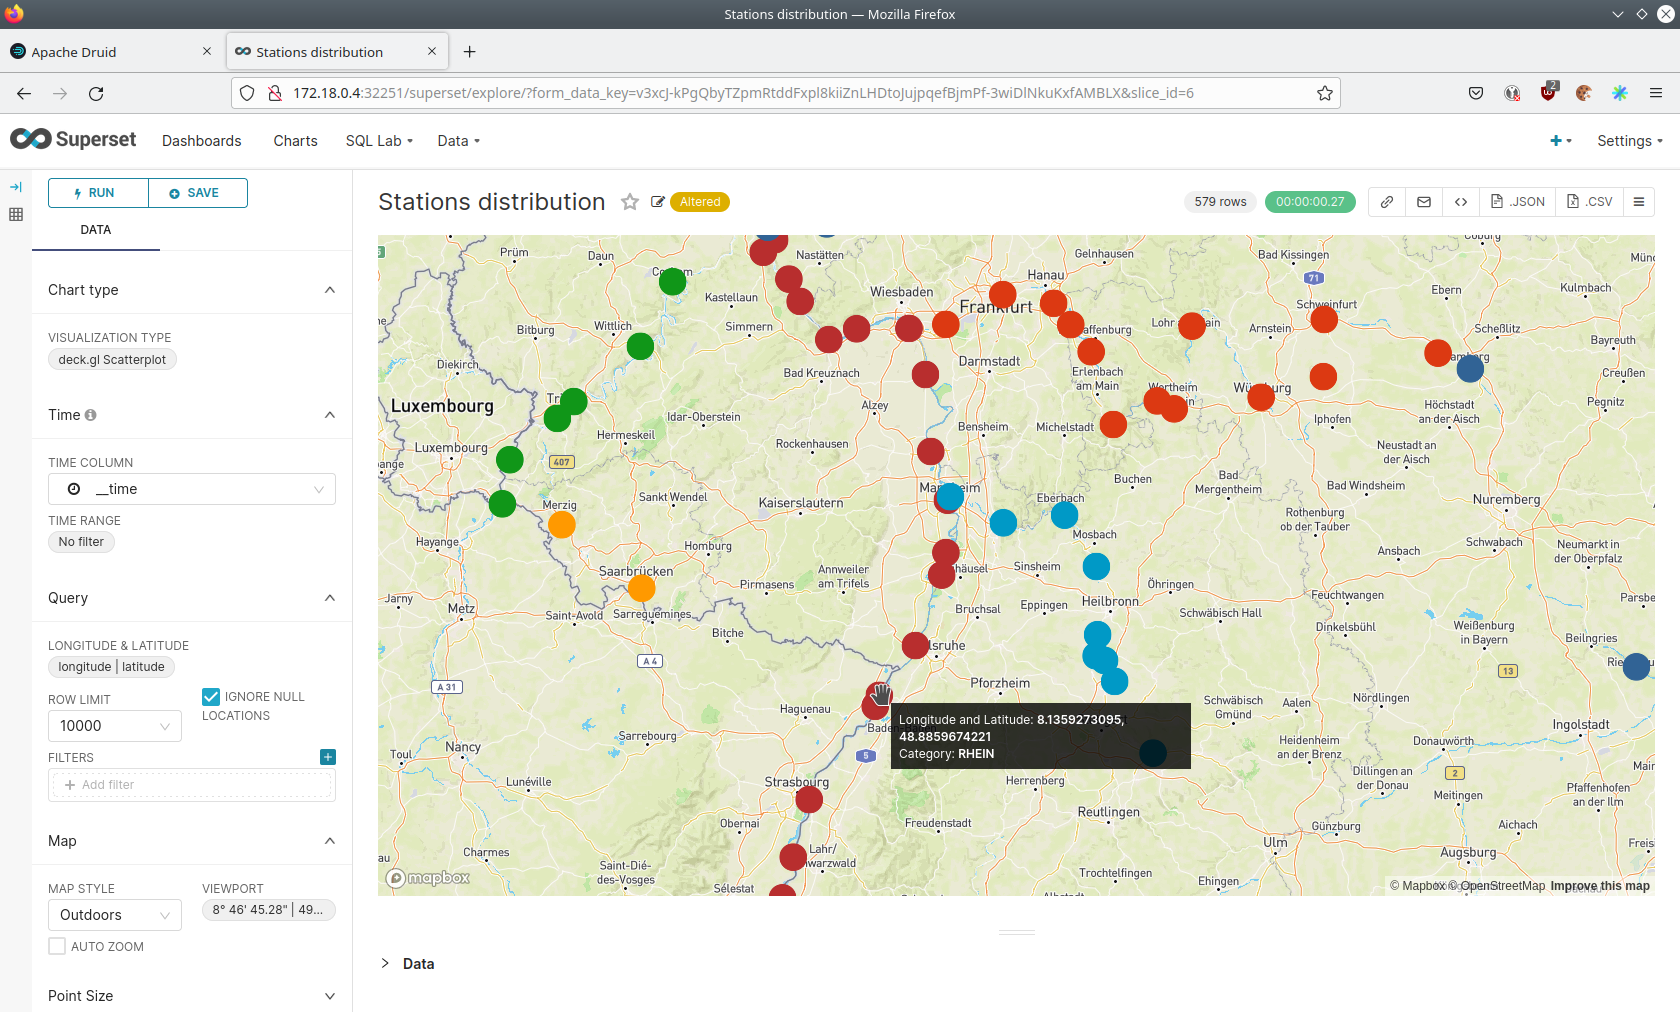
The stations are of course placed alongside of waters. They are colored by the waters they measure, so all stations alongside a body of water have the same color. You can move and zoom the map with your mouse to interactively explore the map. You can e.g. have a detailed look at the water Rhein.
Execute arbitrary SQL statements
Within Superset you can not only create dashboards but also run arbitrary SQL statements.
On the top click on the tab SQL Lab → SQL Editor.
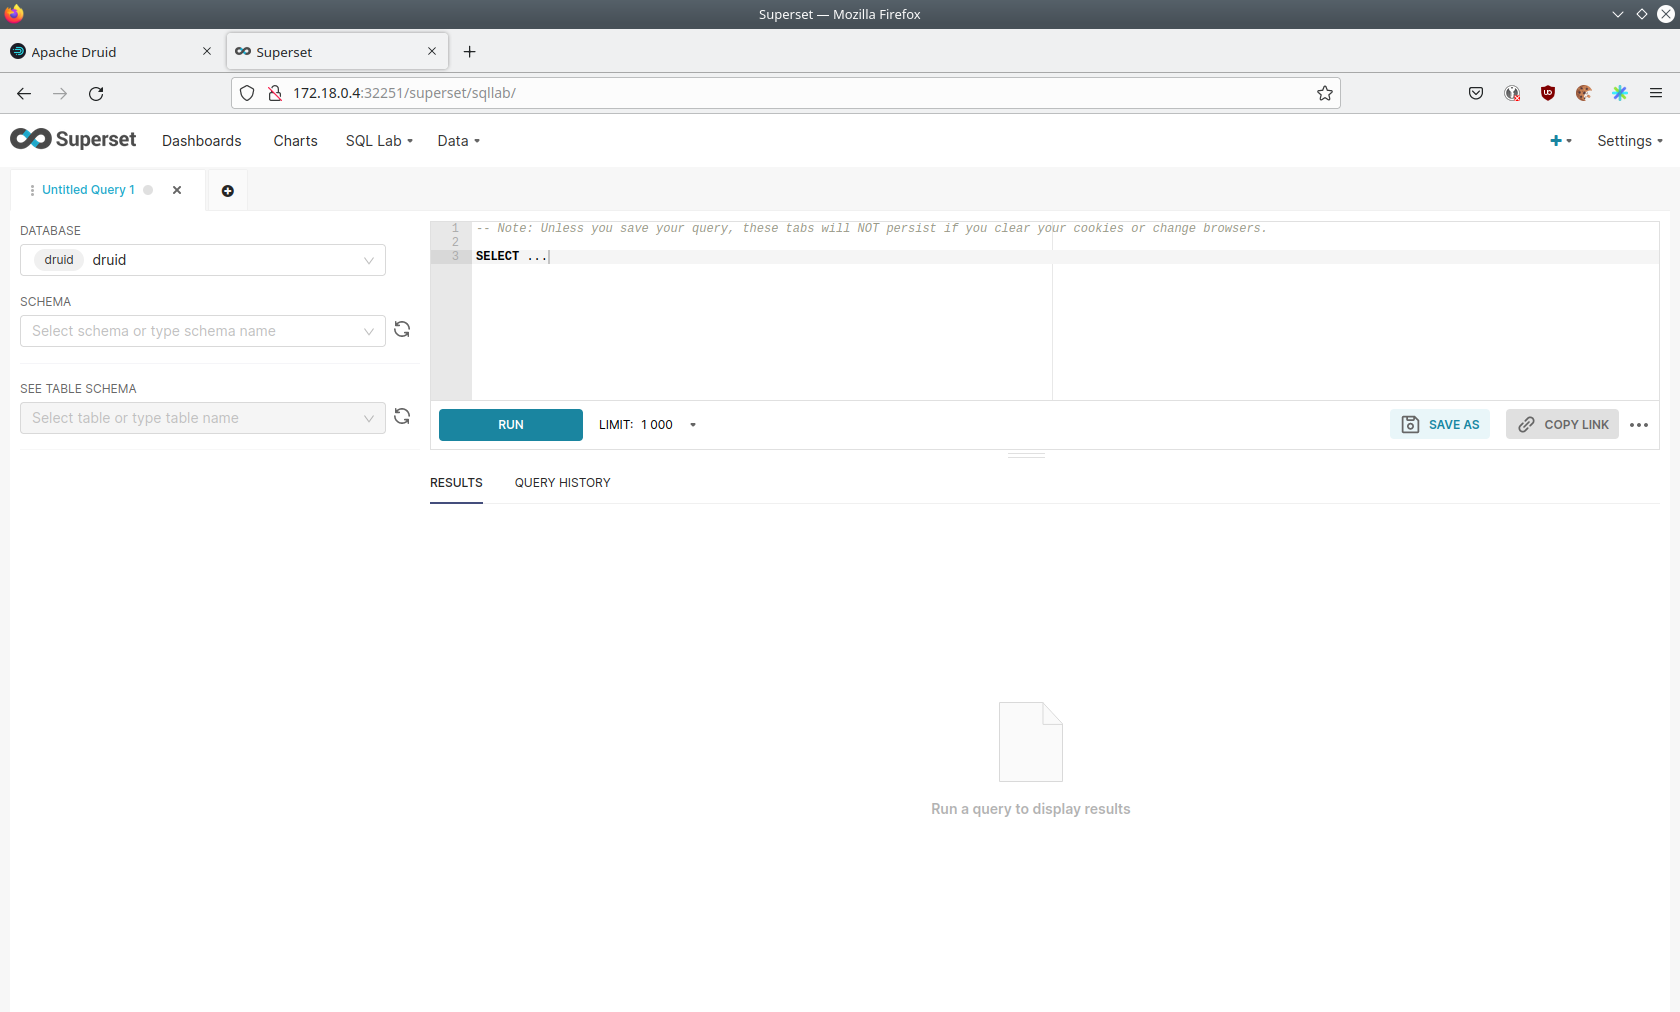
On the left select the database druid, the schema druid and set See table schema to stations or measurements.
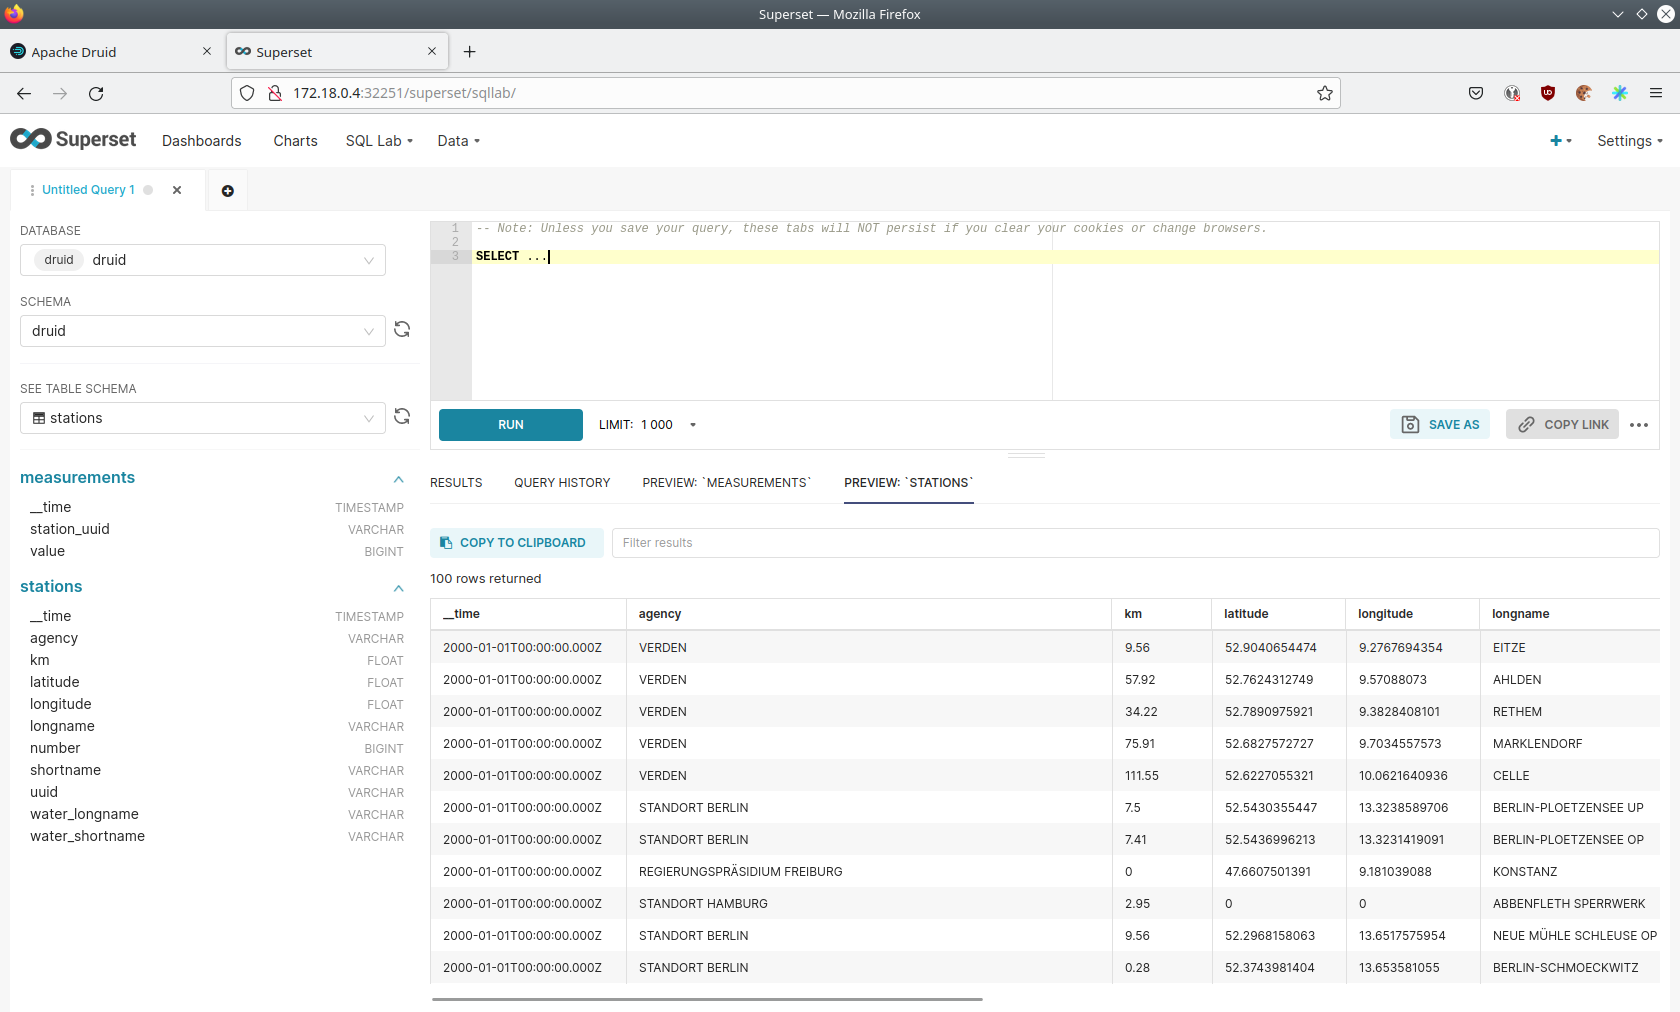
On the right textbox enter the desired SQL statement. We need to join the two tables to get interesting results. To find out the number of measurements the stations made run the following query:
select
  stations.longname as station,
  count(*) as measurements
from measurements inner join stations on stations.uuid = measurements.station_uuid
group by 1
order by 2 desc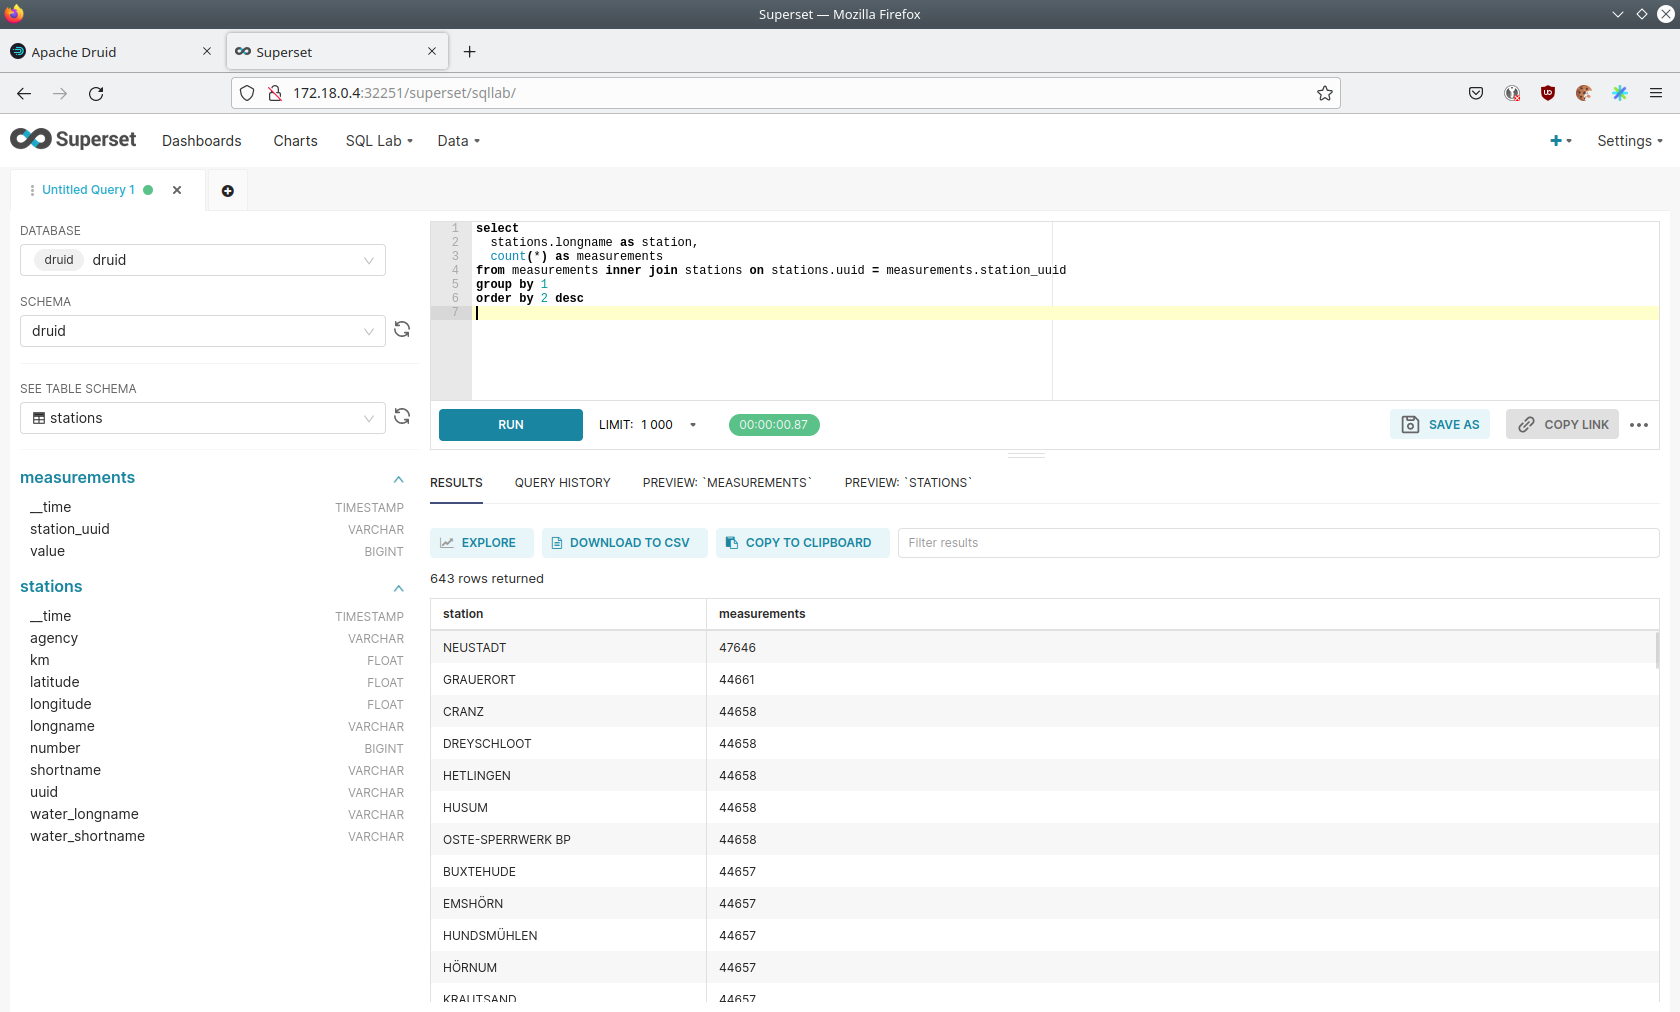
You can also find out the number of measurements for every body of water:
select
  stations.water_longname as water,
  count(*) as measurements
from measurements inner join stations on stations.uuid = measurements.station_uuid
group by 1
order by 2 desc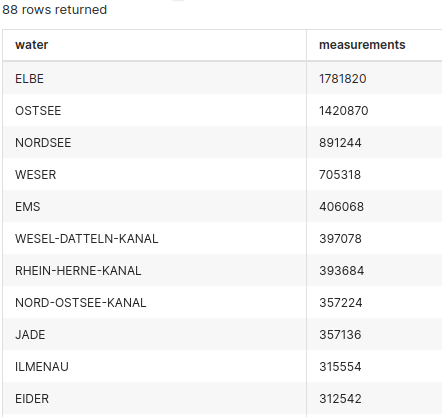
What might also be interesting is the average and current measurement of the stations:
select
  stations.longname as station,
  avg("value") as avg_measurement,
  latest("value") as current_measurement,
  latest("value") - avg("value") as diff
from measurements inner join stations on stations.uuid = measurements.station_uuid
group by 1
order by 2 desc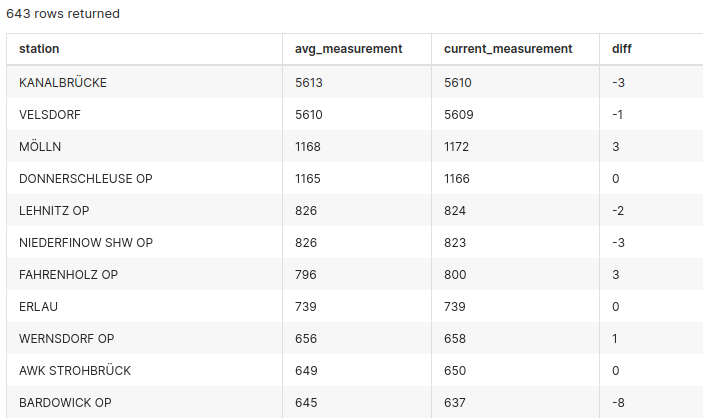
MinIO
The S3 provided by MinIO is used as a persistent deep storage for Druid to store all the data used.
Open the minio endpoint console-http retrieved by stackablectl services list in your browser (http://172.18.0.5:32595 in this case).
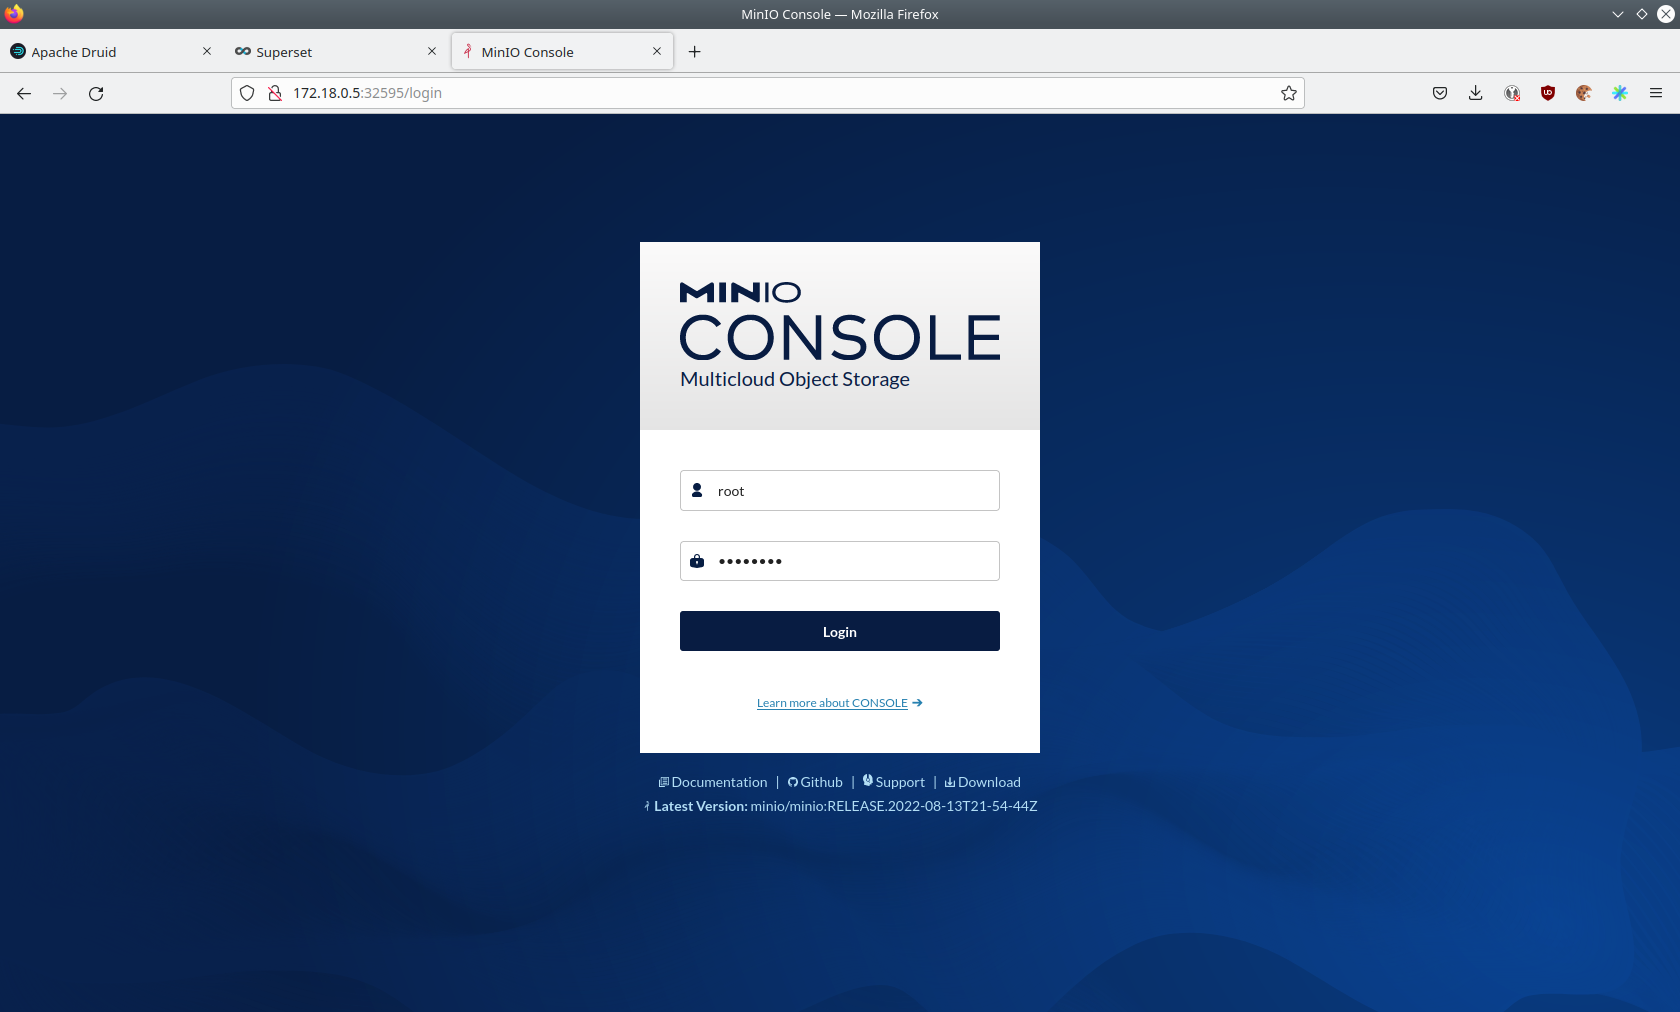
Log in with the username admin and password adminadmin.
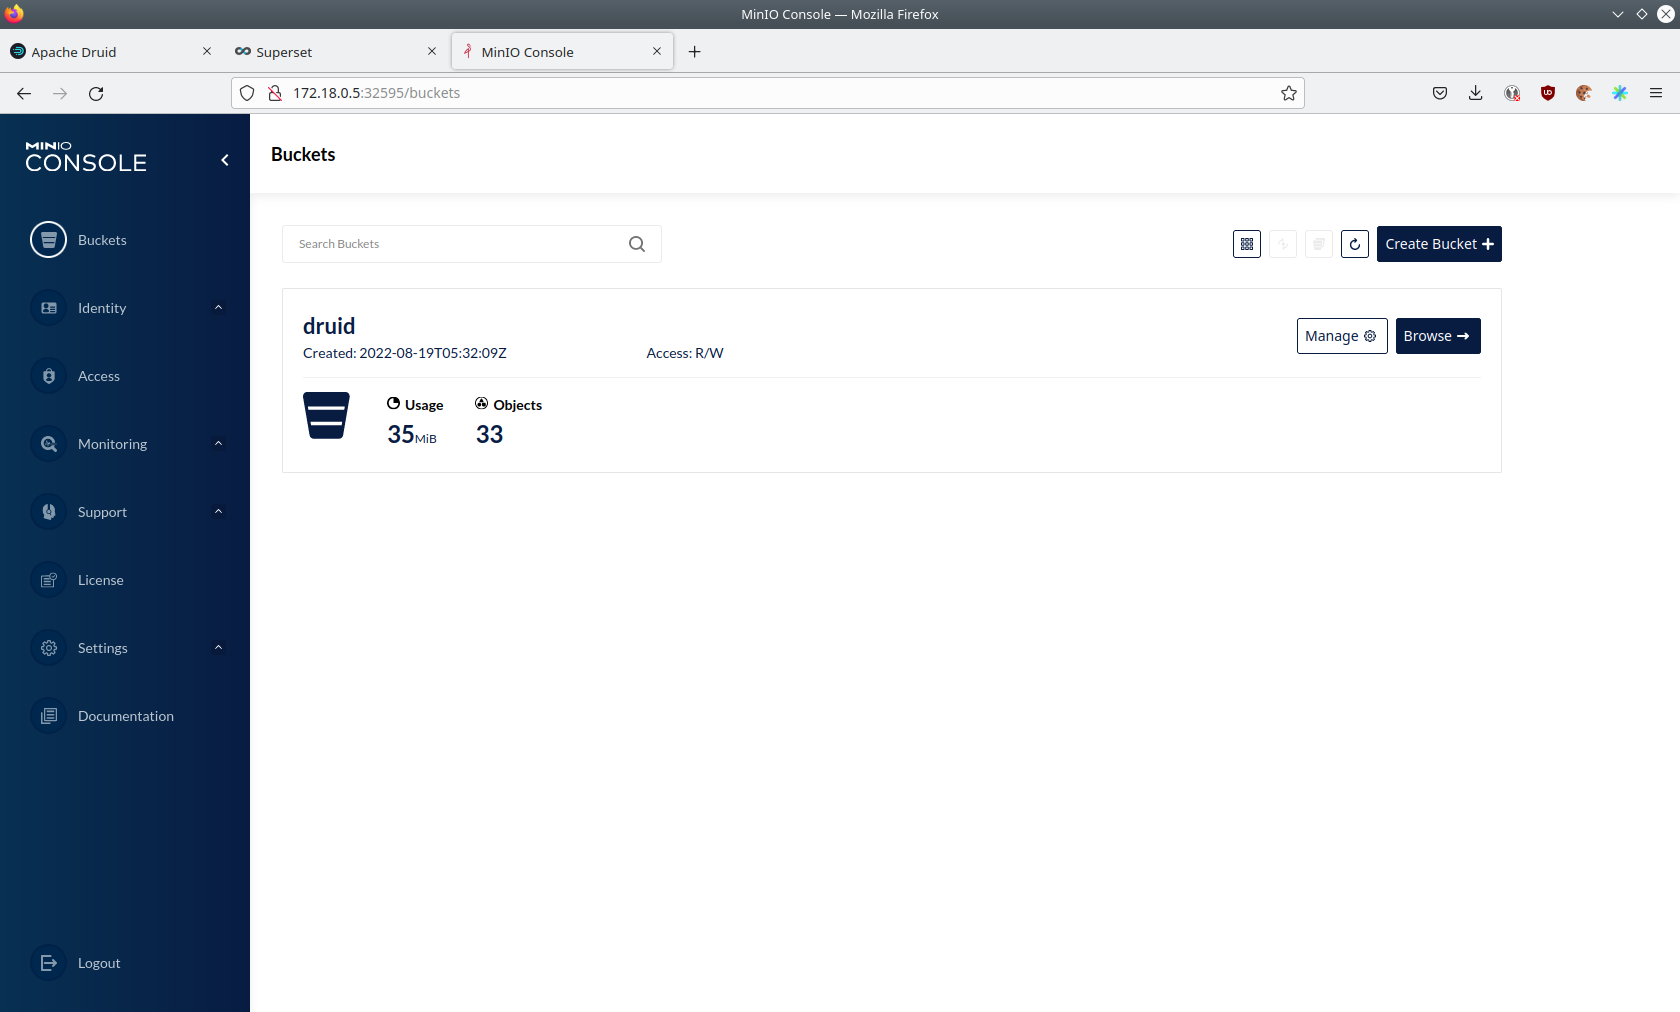
Click on the blue button Browse on the bucket druid and open the folders data.
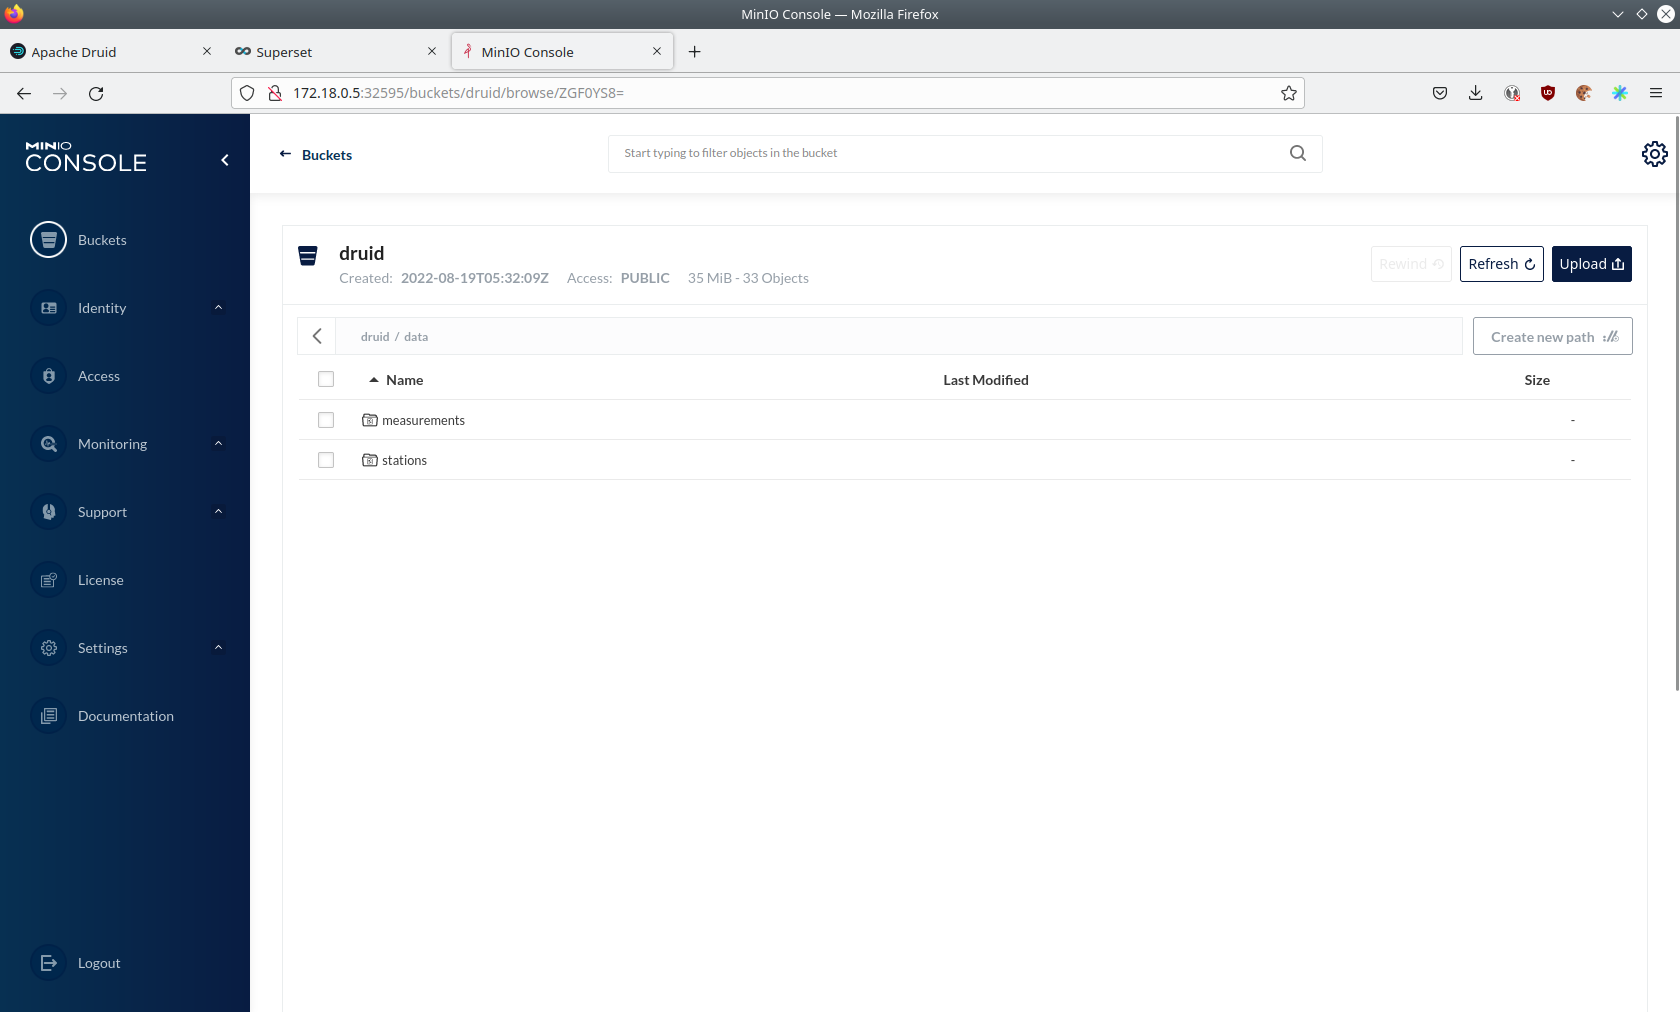
You can see the druid has created a folder for both data sources.
Go ahead and open the folder measurements.
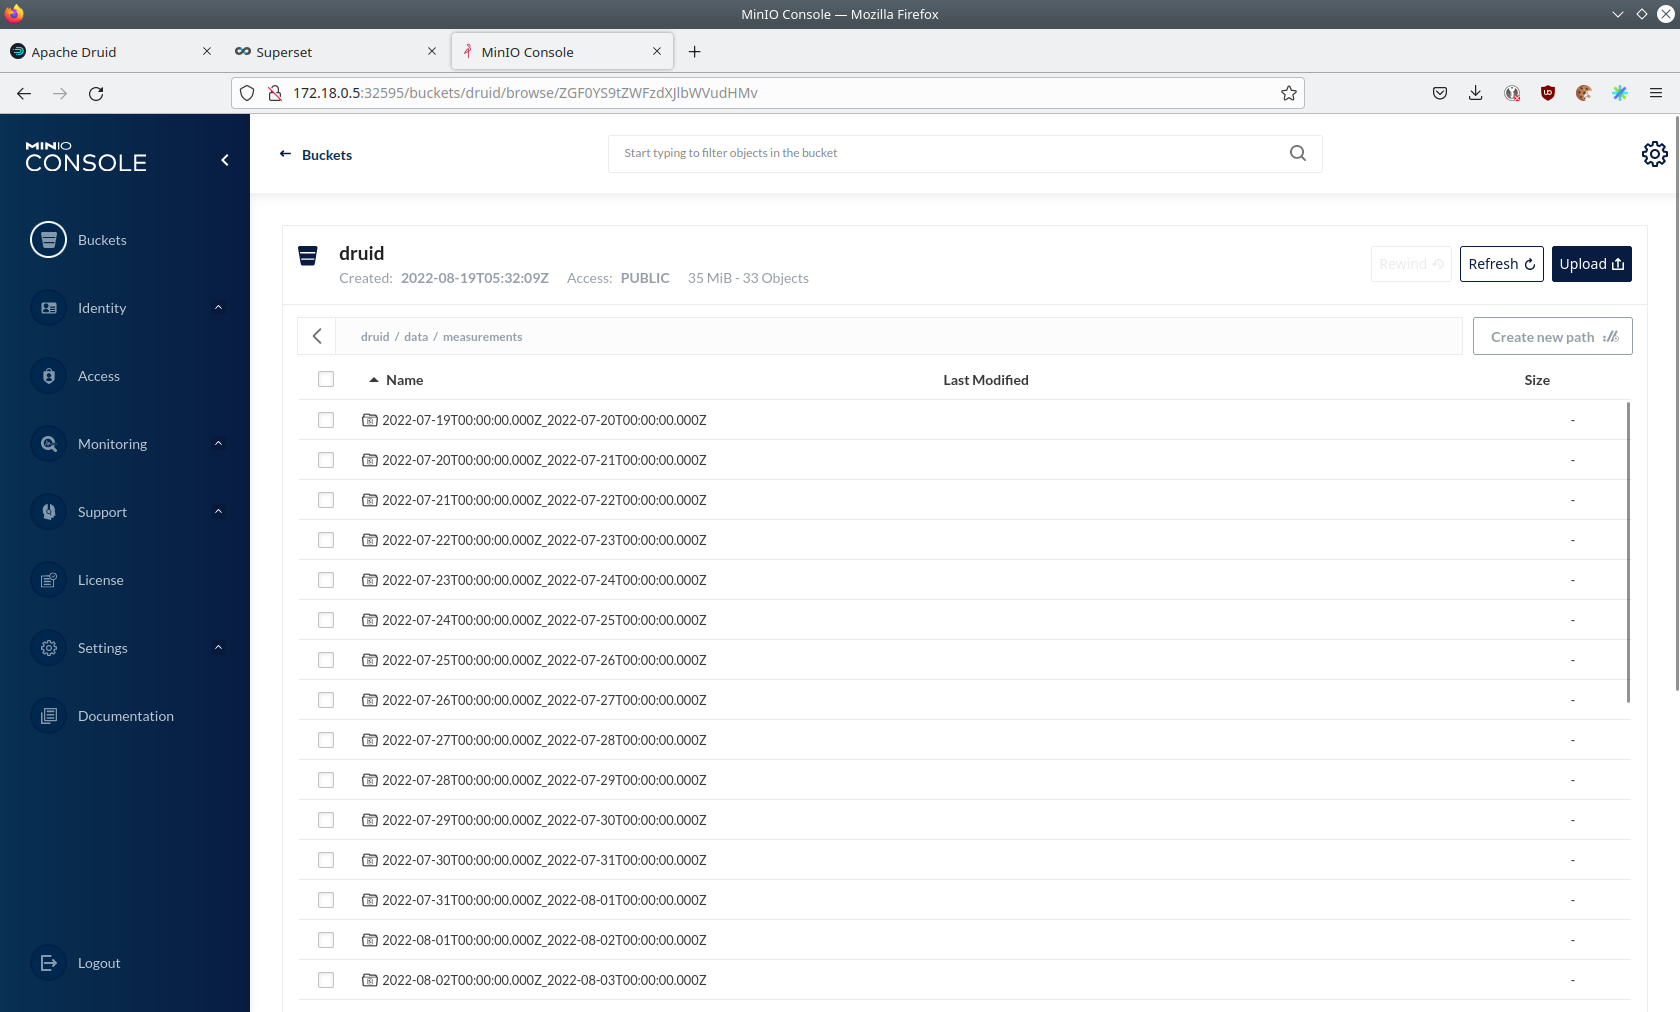
As you can see druid saved 35MB of data within 33 prefixes (folders). One prefix corresponds to one segment which in turn contains all the measurements of a day. If you don’t see any folders or files, the reason is that Druid has not saved its data from memory to the deep storage yet. After waiting for a few minutes the data should have been flushed to S3 and show up.
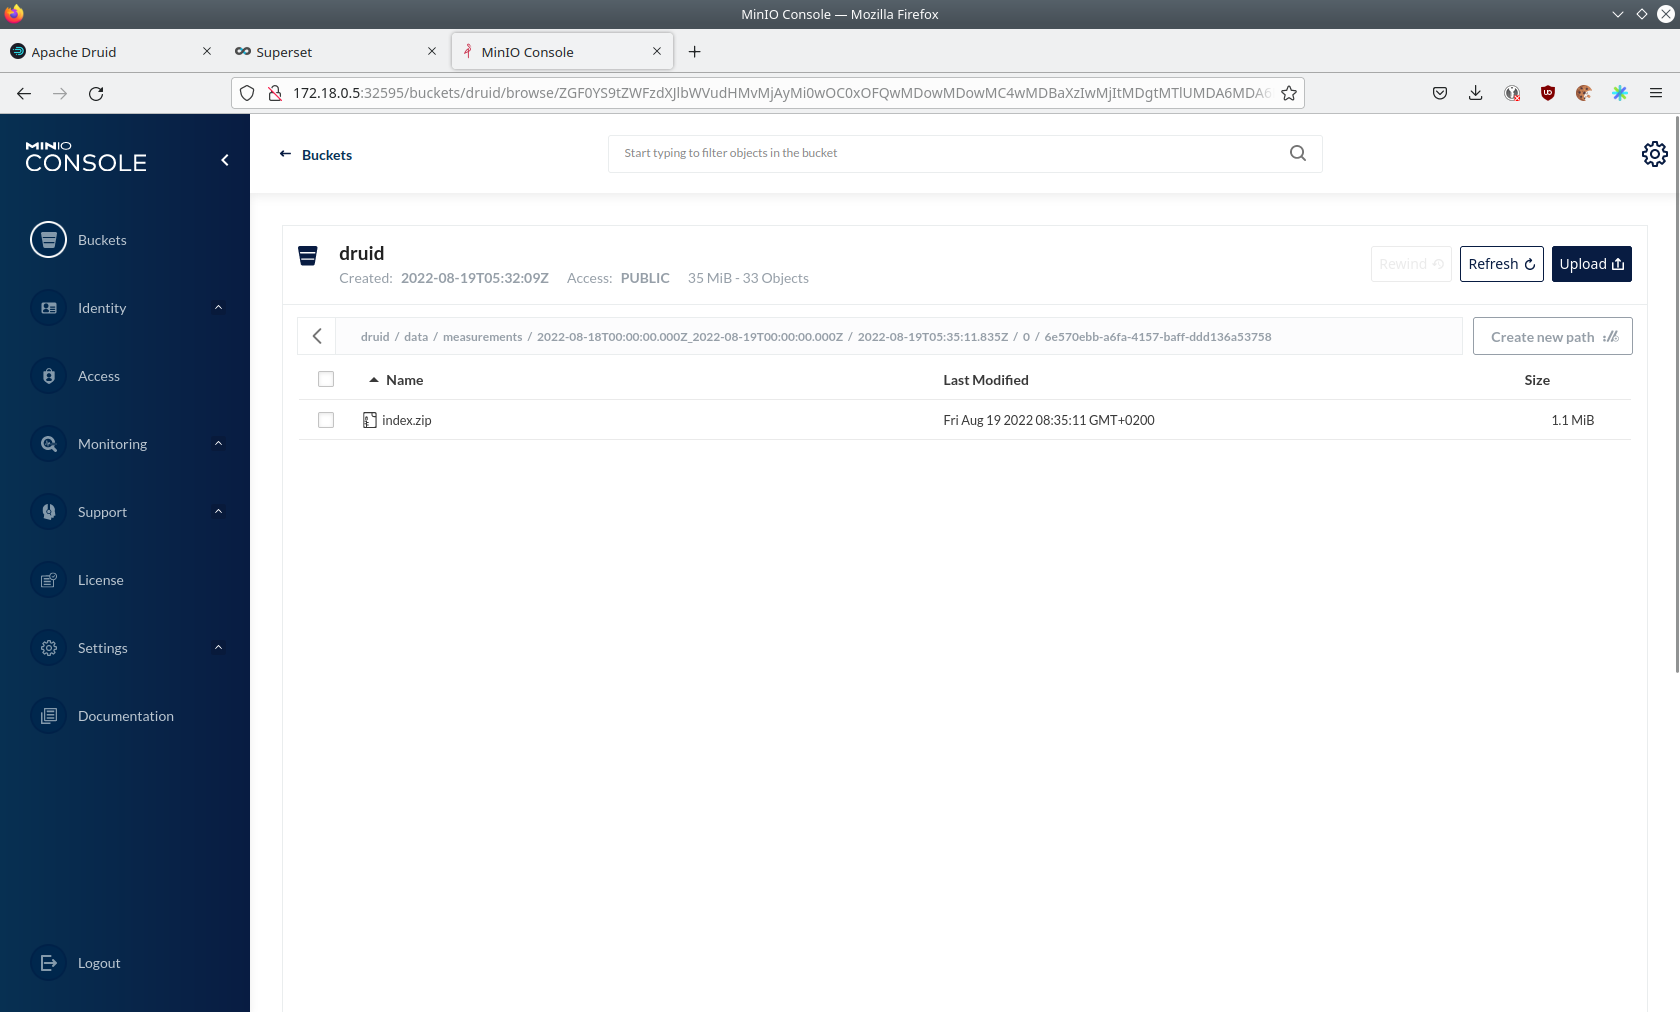
If you open up a prefix for a specific day you can see that Druid has placed a file containing the data of that day there.
Summary
The demo put station records into the Kafka stream pipeline topic station.
It also streamed ~30,000 measurements/s for a total of ~11 million measurements into the topic measurements.
Druid ingested the data near real-time into its data source and enabled SQL access to it.
Superset was used as a web-based frontend to execute SQL statements and build dashboards.
Where to go from here
There are multiple paths to go from here. The following sections can give you some ideas on what to explore next. You can find the description of the water level data on the on the PEGELONLINE rest api documentation (German only).
Execute arbitrary SQL statements
Within Superset (or the Druid webinterface) you can execute arbitrary SQL statements to explore the water level data.
Create additional dashboards
You also have the possibility to create additional charts and bundle them together in a Dashboard. Have a look at the Superset documentation on how to do that.
Load additional data
You can use the NiFi web interface to collect arbitrary data and write it to Kafka (it’s recommended to use new Kafka topics for that). You can use a Kafka client like kafkacat to create new topics and ingest data. Using the Druid web interface, you can start an ingestion job that consumes the data and stores it in an internal data source. There is a great tutorial from Druid on how to do this. Afterwards the data source is available to be analyzed within Druid and Superset the same way the water level data is.