spark-k8s-anomaly-detection-taxi-data
|
This guide assumes you already have the demo |
This demo will
-
Install the required Stackable operators
-
Spin up the following data products
-
Trino: A fast distributed SQL query engine for big data analytics that helps you explore your data universe. This demo uses it to enable SQL access to the data
-
Spark: A multi-language engine for executing data engineering, data science, and machine learning. This demo uses it to batch process data from S3 by training and scoring an unsupervised anomaly detection model, writing the results into a Trino table. In this demo Spark uses an isolation forest algorithm from the scikit-learn machine learning library.
-
MinIO: A S3 compatible object store. This demo uses it as persistent storage to store all the data used
-
Hive metastore: A service that stores metadata related to Apache Hive and other services. This demo uses it as metadata storage for Trino and Spark
-
Open policy agent (OPA): A open source, general-purpose policy engine that unifies policy enforcement across the stack. This demo uses it as the authorizer for Trino, which decides which user is able to query which data.
-
Superset: A modern data exploration and visualization platform. This demo utilizes Superset to retrieve data from Trino via SQL queries and build dashboards on top of that data
-
-
Copy the taxi data in parquet format into the s3 staging area
-
A Spark batch job is started, which fetches the raw data, trains and scores a model, writing out the results to Trino/S3 for use by Superset
-
Create Superset dashboards for visualization of the anomaly detection scores You can see the deployed products as well as their relationship in the following diagram:

List deployed Stackable services
To list the installed Stackable services run the following command:
$ stackablectl services list --all-namespaces
PRODUCT   NAME          NAMESPACE               ENDPOINTS                                     EXTRA INFOS

 hive      hive          spark-k8s-ad-taxi-data  hive                172.18.0.2:31912
                                                 metrics             172.18.0.2:30812

 hive      hive-iceberg  spark-k8s-ad-taxi-data  hive                172.18.0.4:32133
                                                 metrics             172.18.0.4:32125

 opa       opa           spark-k8s-ad-taxi-data  http                http://172.18.0.3:31450

 superset  superset      spark-k8s-ad-taxi-data  external-superset   http://172.18.0.2:31339   Admin user: admin, password: adminadmin

 trino     trino         spark-k8s-ad-taxi-data  coordinator-metrics 172.18.0.3:32168
                                                 coordinator-https   https://172.18.0.3:31408

 minio     minio-trino   spark-k8s-ad-taxi-data  http                http://172.18.0.3:30589   Third party service
console-http http://172.18.0.3:31452 Admin user: admin, password: adminadmin|
When a product instance has not finished starting yet, the service will have no endpoint. Starting all the product instances might take a considerable amount of time depending on your internet connectivity. In case the product is not ready yet a warning might be shown. |
MinIO
List buckets
The S3 provided by MinIO is used as persistent storage to store all the data used.
Open the minio-trino endpoint console-http retrieved by stackablectl services list in your browser (http://172.18.0.3:31452 in this case).

Log in with the username admin and password adminadmin.
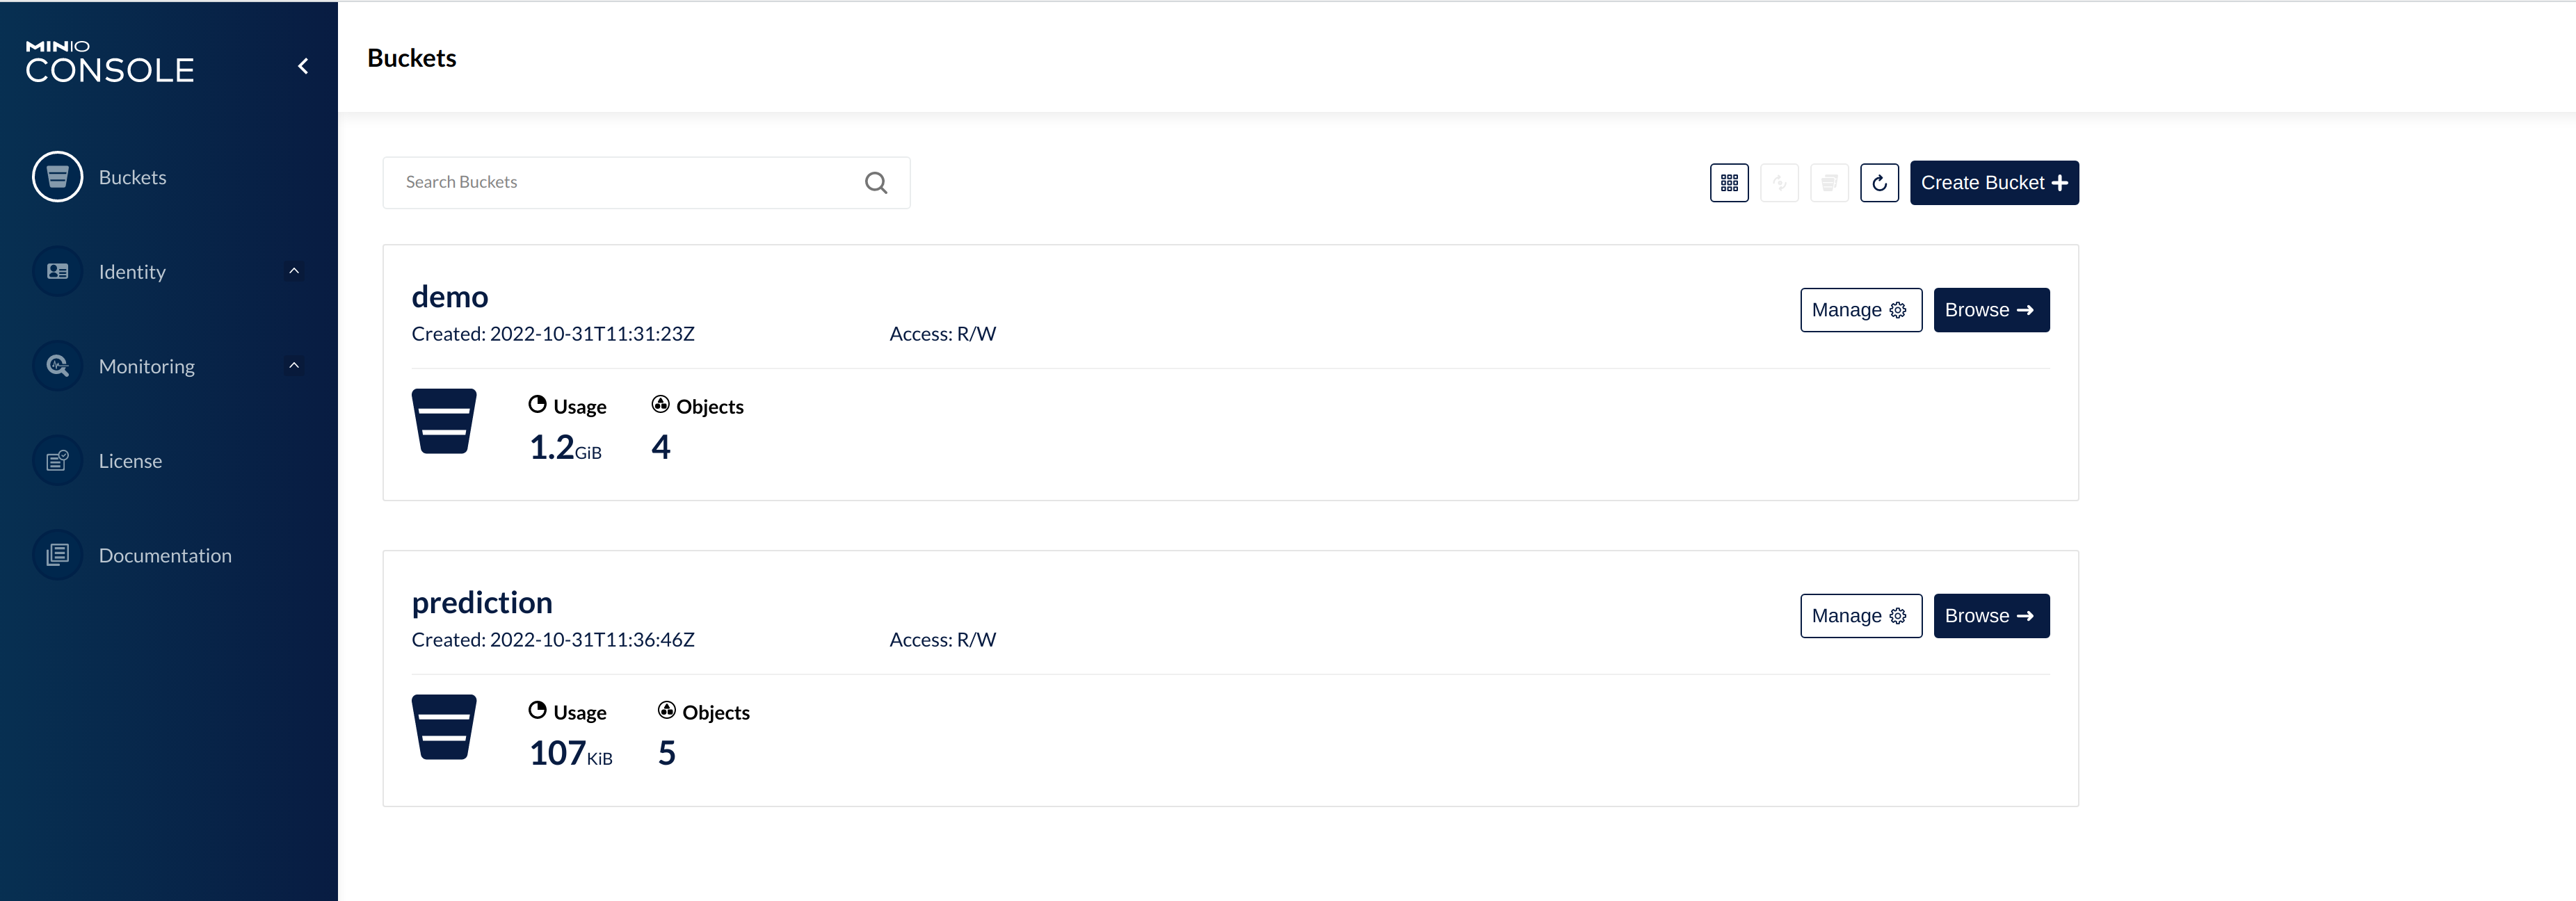
Here you can see the two buckets the S3 is split into:
-
demo: The demo loads static datasets into this area. It is stored in parquet format. It forms the basis for the model that will be trained by Spark. -
prediction: This bucket is where the model scores are persisted. The data is stored in the Apache Iceberg table format.
Inspect raw data
Click on the blue button Browse on the bucket demo.
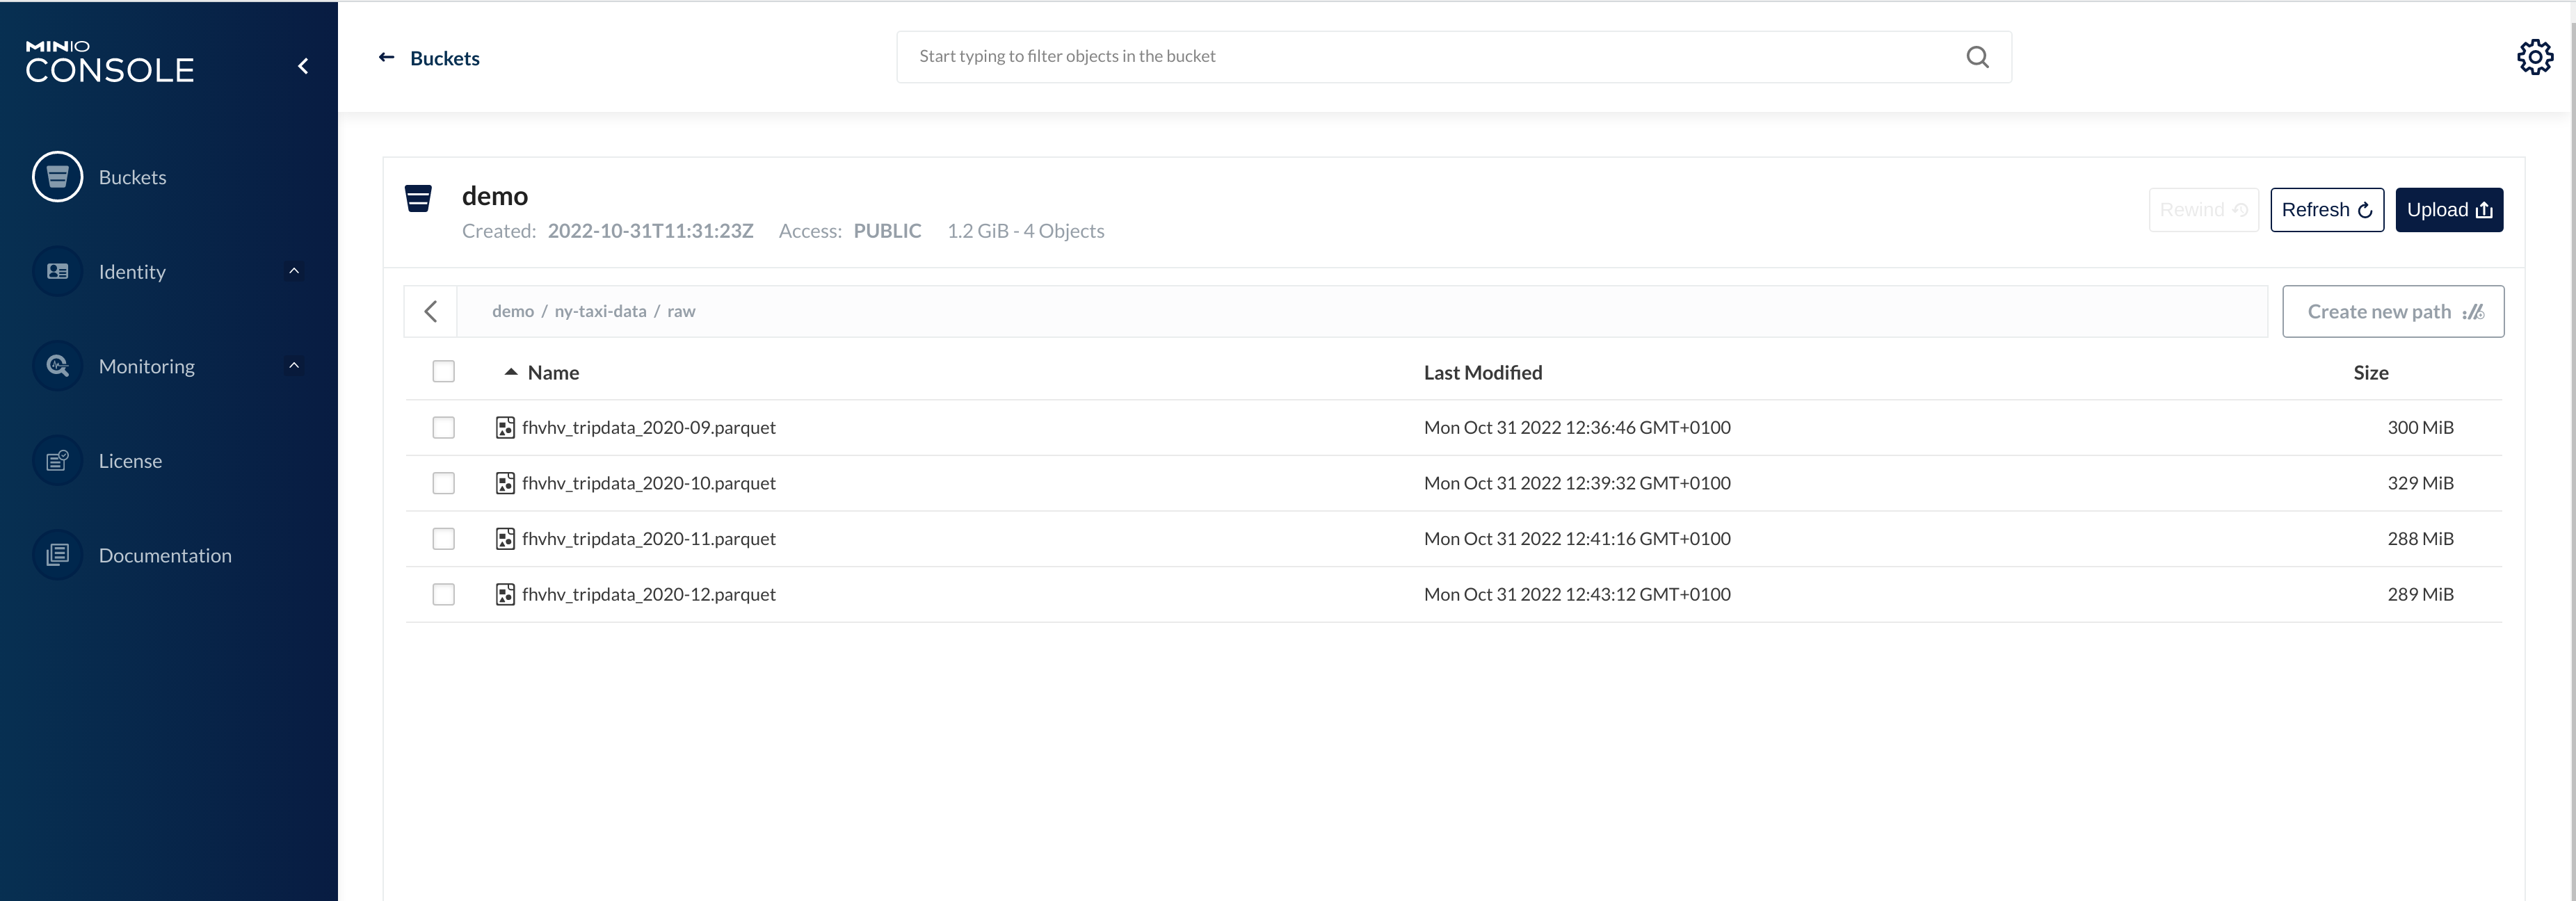
You can see a folder (called prefixes in S3) containing a dataset of similarly-structured data files. The data is partitioned by month and contains several hundred MBs of data. This may not seem particularly large for a data-set, but the model is a time-series model where the data has decreasing relevance the "older" it is: this is especially when the data is subject to multiple external factors, many of which are unknown and fluctuating in scope and effect.
The second bucket prediction contains the output from the model scoring process:
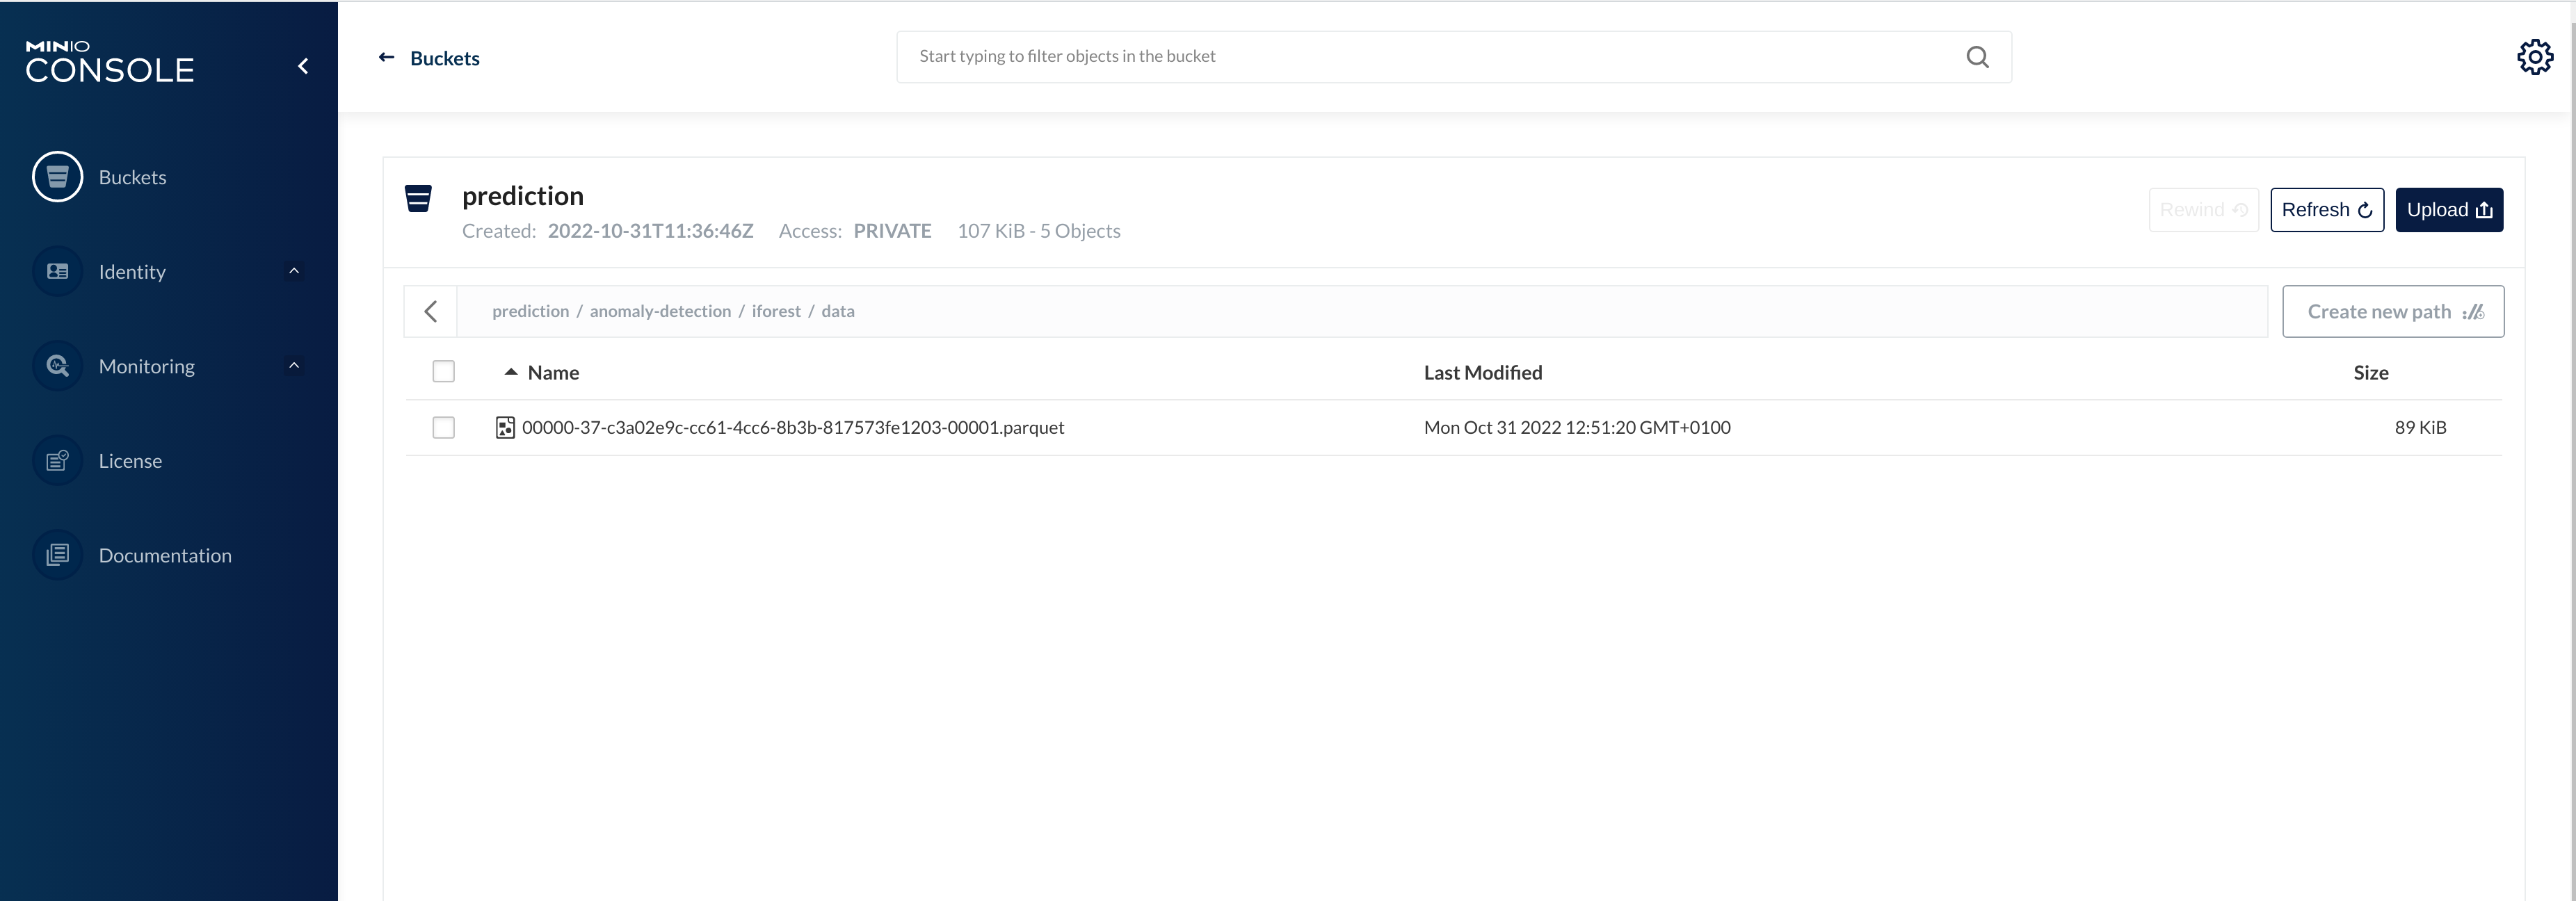
This is a much smaller file as it only contains scores for each aggregated time period.
Spark
The Spark job ingests the raw data and performs some fairly straightforward data wrangling and feature engineering. Any windowing features designed to capture the time-series nature of the data - such as lags or rolling averages - need to make use of evenly distributed partitions so that Spark can execute these tasks in parallel. The job uses an implementation of the Isolation Forest algorithm provided by the scikit-learn library: the model is trained in a single task, but is then distributed to each executor from where it is invoked by a user-defined function (see this article for how to call the sklearn library with a pyspark UDF). The Isolation Forest algorithm is used for unsupervised model training, which means that a labelled set of data - against which the model is trained - is not necessary. This makes model preparation easier as we do not have to divide the data set into training and validation datasets.
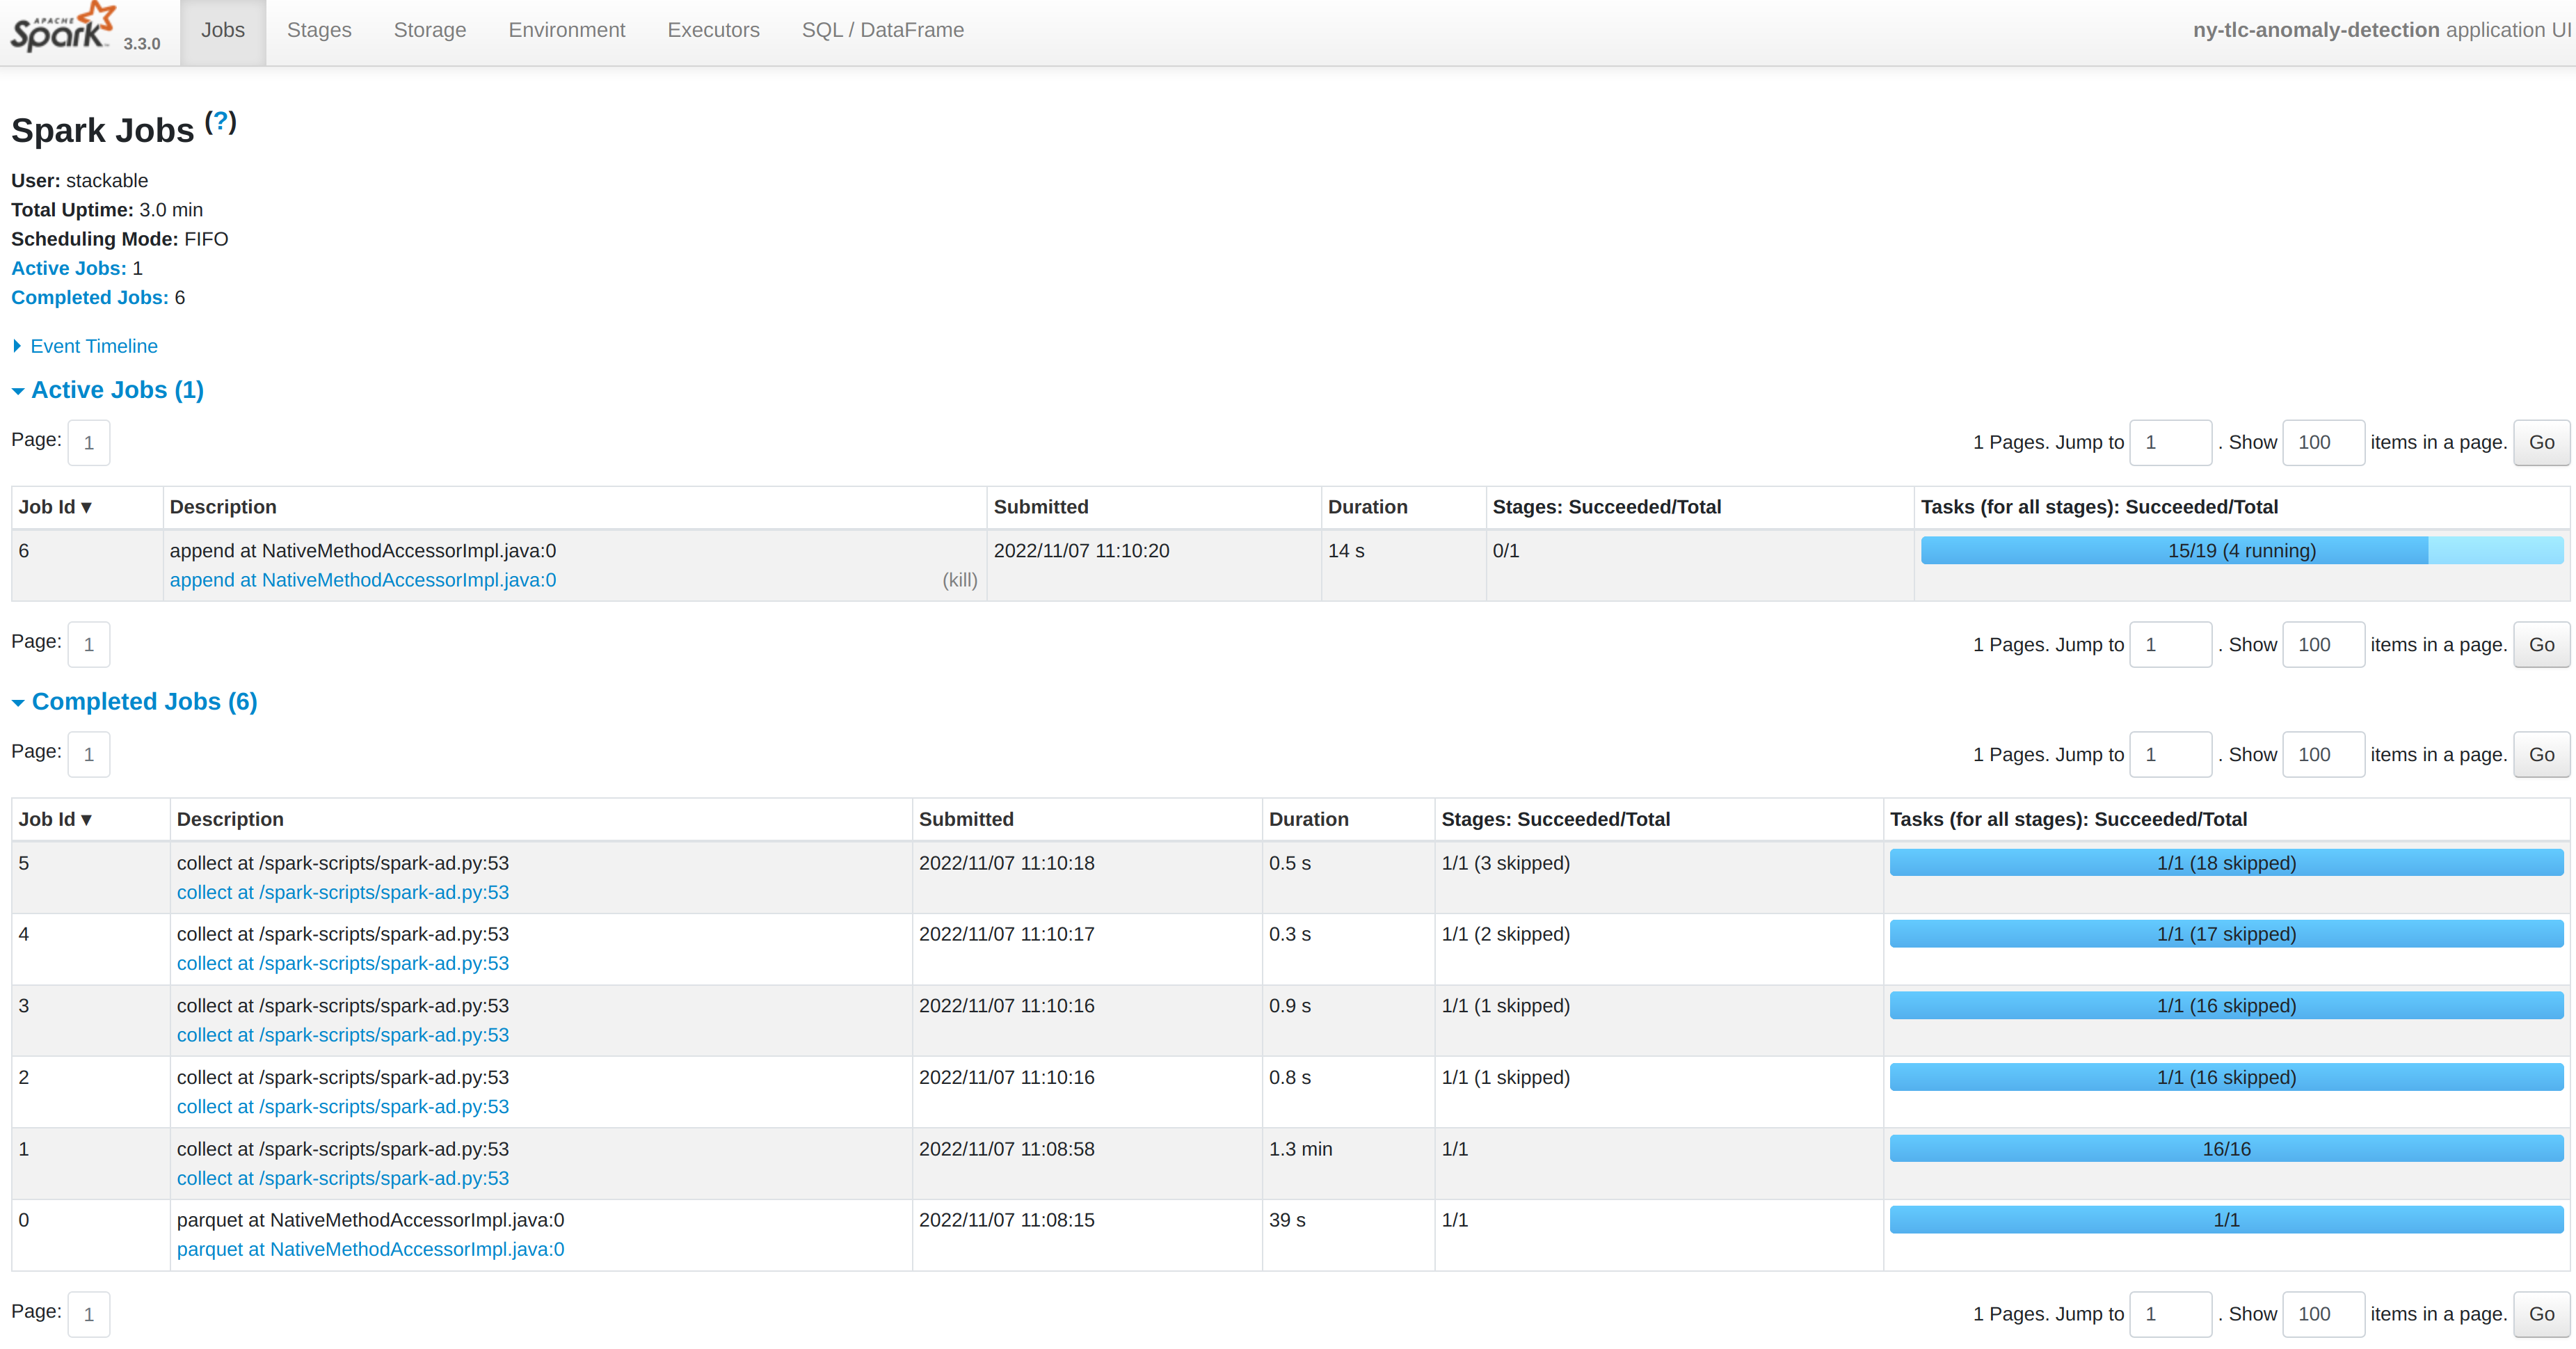
You can inspect a running Spark job by forwarding the port used by the Spark-UI:
kubectl port-forward spark-ad-driver 4040and then opening a browser tab to http://localhost:4040:
Dashboard
The anomaly detection dashboard is pre-defined and accessible under Dashboards when you have logged in to Superset:
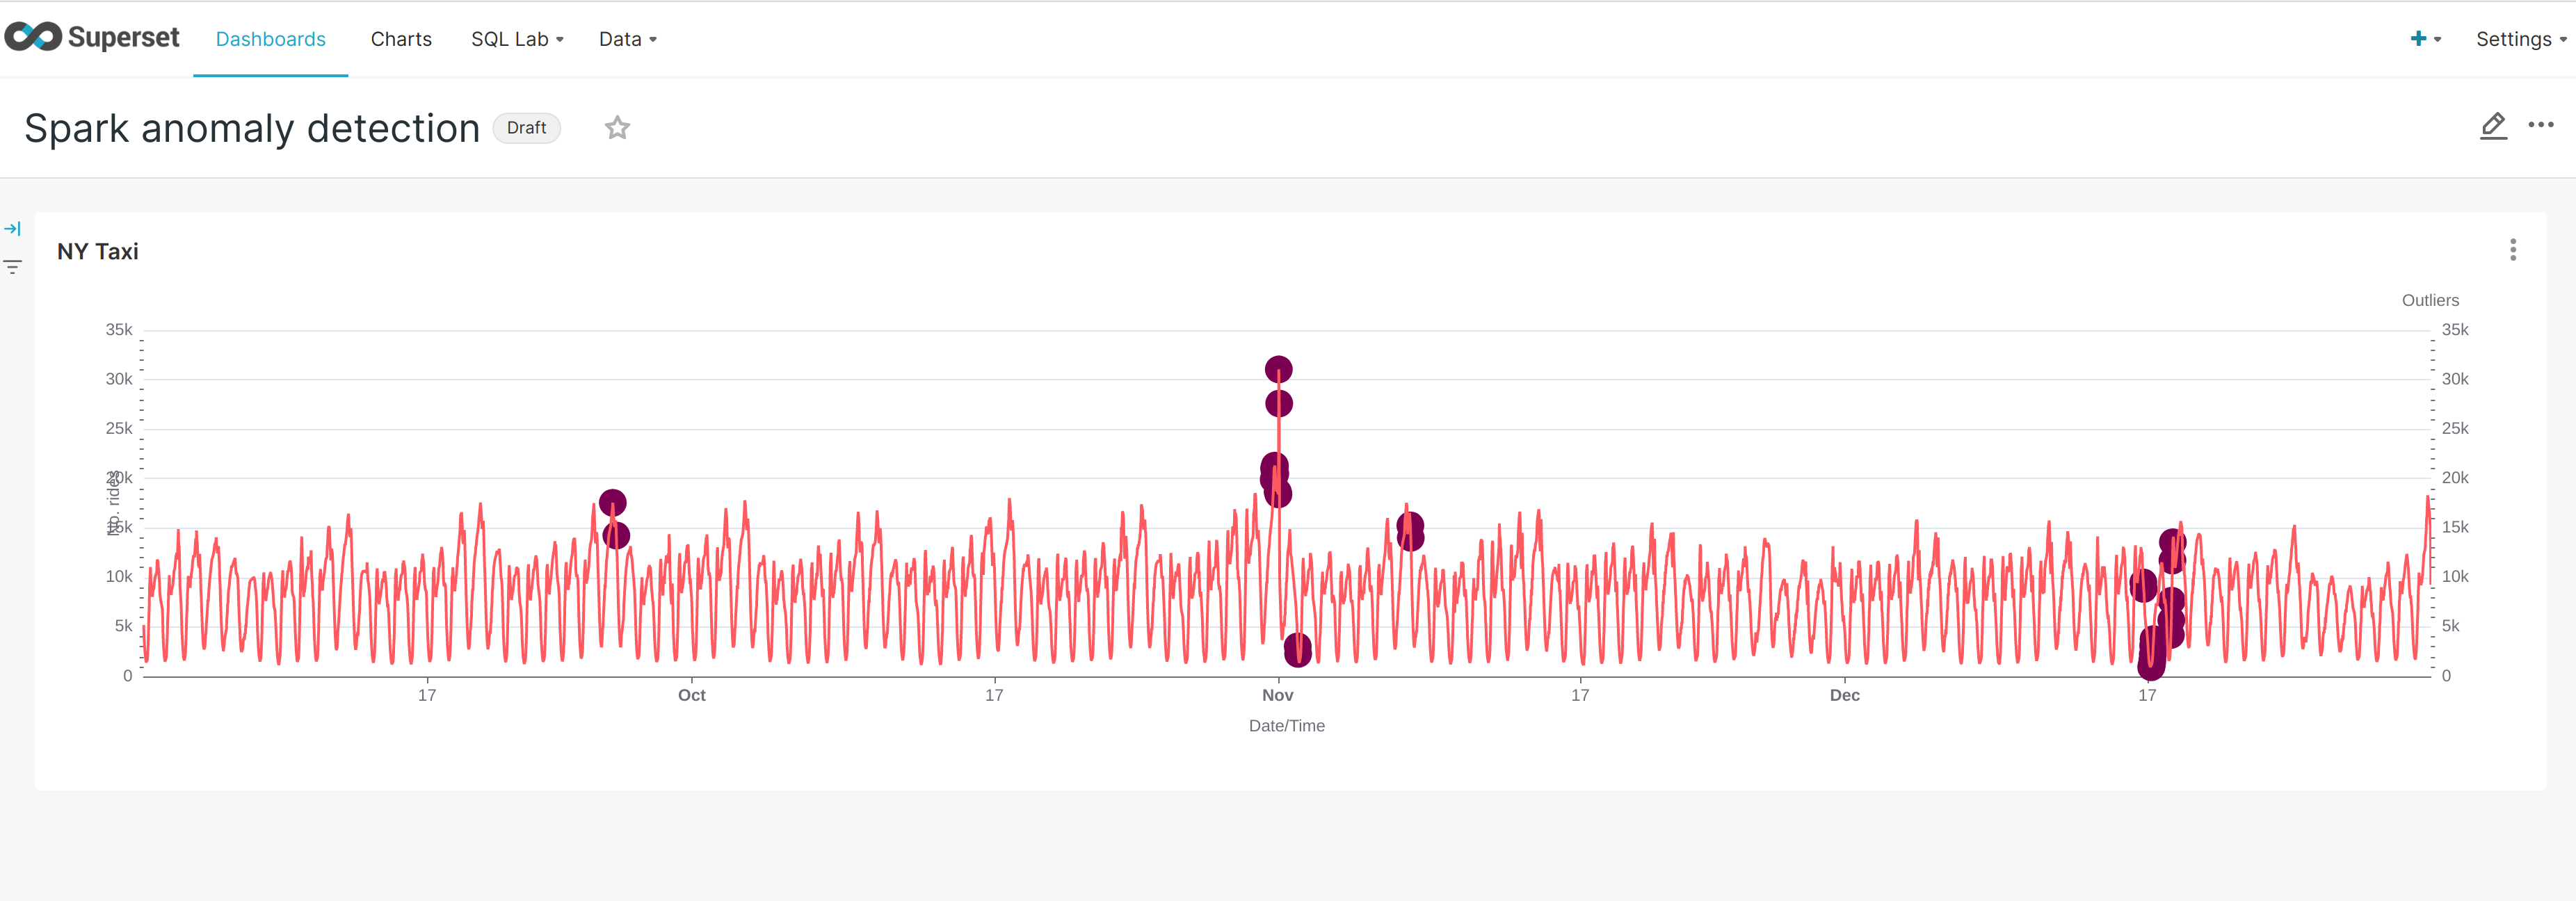
Have can we interpret the results? This is where the fun begins (!) as the model does not yield data that can be used directly for a root cause analysis. An isolation forest is a type of random forest that measures how many branches are needed in its underlying decision trees to isolate each data point: the more anomalous the data, the easier this will be - a clear outlier may only need a single partition to isolate it, whereas tightly clustered data will require significantly more. The number-of-partitions-to-isolate is therefore in inverse proportion to the anomaly-ness of the data.